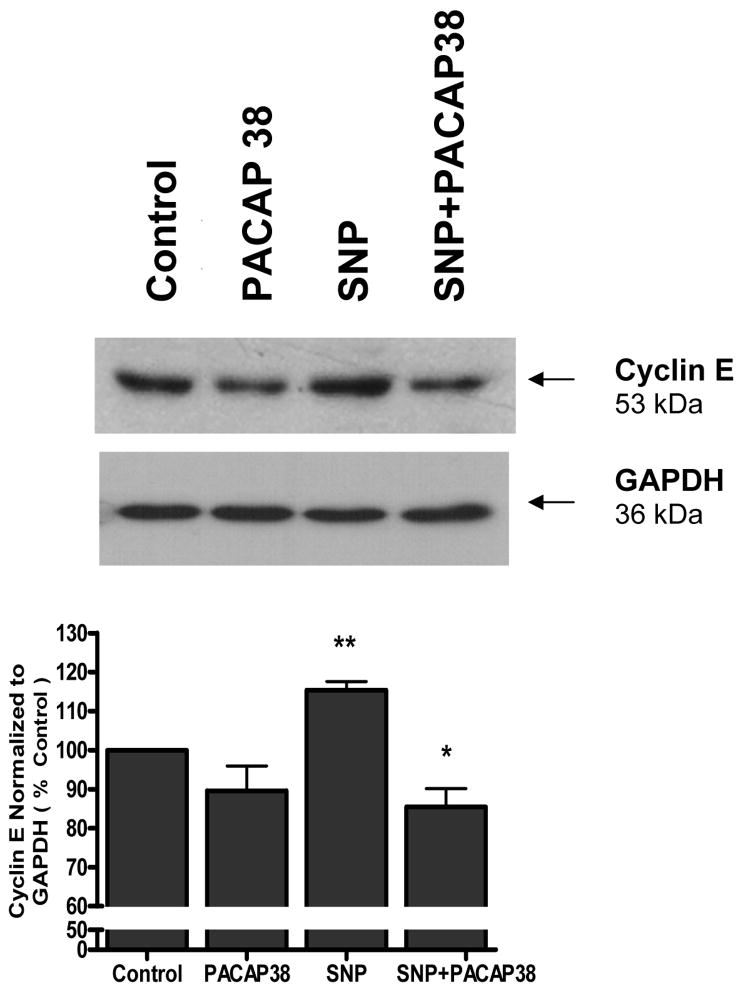
Figure 3. PACAP38 downregulated SNP-induced cell cycle protein (cyclin E) expression.
Cortical neurons were exposed to either medium (control), 1 mM SNP, 100 nM PACAP38, or SNP plus PACAP38 for 4 h, the cell lysates collected and western blot analysis performed for cyclin E expression. Histogram represents densitometric measurements of three western blot experiments normalized to GAPDH levels. Treatments were compared by one-tailed t-tests.
** vs control
* vs SNP

