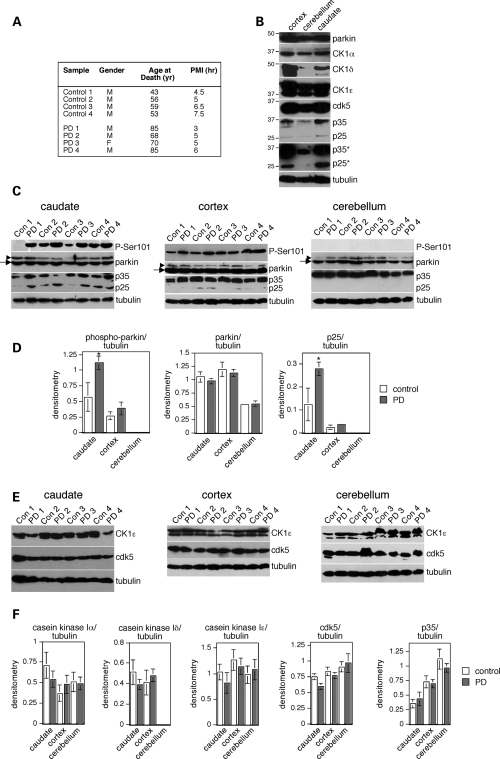
Figure 6.
Selective increase in phospho-parkin and p25 in distinct areas of idiopathic PD brains. (A) Gender, age at death (years) and postmortem interval (PMI, h) for the eight human brains analyzed here. (B) Relative levels of total parkin, casein kinase I isoforms α, δ and ε, cdk5, p35 and p25 in three distinct brain areas from a control patient, and of tubulin as a protein loading control. *Overexposed blot shows the absence of detectable p25 levels in the cerebellum. (C) Levels of phospho-parkin (P-Ser101), parkin, p35/p25 and tubulin as a protein loading control were analyzed in caudate, cortex and cerebellum from four control and four PD patients which were matched for postmortem interval tissue collection. Arrows indicate parkin band, arrowheads indicate cross-reacting band detected with the anti-parkin antibody (Abcam). (D) Levels of phospho-parkin, parkin and p25 were normalized to tubulin levels and plotted on a histogram (n = 4; mean±S.E.M., *P < 0.05). Error bars are only depicted when larger than column lines. (E) Levels of casein kinase Iε (CK1ε), cdk5 and tubulin as a protein loading control were analyzed in caudate, cortex and cerebellum from four controls and four PD patients matched for postmortem interval tissue collection. (F) Levels of CK1α, δ and ε, cdk5 and p35 were normalized to tubulin levels and plotted on a histogram (n = 4; mean±S.E.M.). Error bars are only depicted when larger than column lines.

