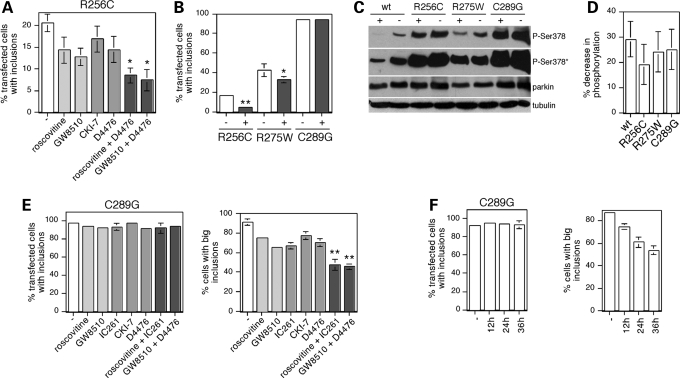
Figure 8.
Inhibition of parkin phosphorylation decreases mutant parkin aggregation. (A) The percentage of transfected cells displaying R256C-mutant parkin aggregates were quantified in the absence (−) or presence of various kinase inhibitors, or combinations thereof, present for 12 h before fixation. Inhibitors used included roscovitine (0.5 µm), GW8510 (0.25 µm), CKI-7 (150 µm) and D4476 (17.5 µm). Bars depict mean±S.E.M. (n = 3). Statistically significant additive effects were observed when using a combination of kinase inhibitors, when compared with individual inhibitor treatments. *P < 0.1. (B) Quantification of the percentage of transfected cells displaying R256C-mutant, R275W-mutant or C289G-mutant parkin aggregates in the absence (−) or presence (+) of 0.25 µm GW8510 and 17.5 µm D4476 (R256C, n = 5; R275W, n = 3; C289G, n = 4). Bars depict mean±S.E.M. *P < 0.1; **P < 0.01. Error bars are only depicted when larger than column lines. (C) Analysis of the phosphorylation status of parkin in HEK293T cells transfected with wild-type (wt) or mutant parkin variants, treated without (−) or with (+) 0.25 µm GW8510 and 17.5 µm D4476 for 12 h before analysis upon blotting with the phospho-Ser378 antibody (*overexposed blot to show phosphorylation of wild-type parkin), an anti-parkin antibody (Abcam) or an anti-tubulin antibody. (D) Quantification of experiments of the type depicted in (C), where the amount of phospho-parkin in the presence of inhibitors, when compared with that in the absence of inhibitors, is plotted as % decrease in phosphorylation. Bars depict mean±S.E.M. (n = 3). (E) The percentage of transfected cells displaying C289G-mutant parkin aggregates (left) and the percentage of those cells displaying (at least) one large perinuclear aggregate (right) were quantified in the absence (−) or presence of various kinase inhibitors, or combinations thereof, present for 12 h before fixation. Inhibitors used included roscovitine (0.5 µm), GW8510 (0.25 µm), IC261 (25 µm), CKI-7 (150 µm) and D4476 (17.5 µm). Bars depict mean±S.E.M. (n = 3). Statistically significant additive effects were observed when using a combination of kinase inhibitors, when compared with individual inhibitor treatments. **P < 0.05. (F) The percentage of transfected cells displaying C289G-mutant parkin aggregates (left) and the percentage of those cells displaying (at least) one large perinuclear aggregate (right) were quantified in the absence (−) or presence of 0.5 µm roscovitine and 150 µm CKI-7. Inhibitors were added 12 h before fixation (12 h), 24 and 12 h before fixation (24 h) or 36, 24 and 12 h before fixation (36 h).

