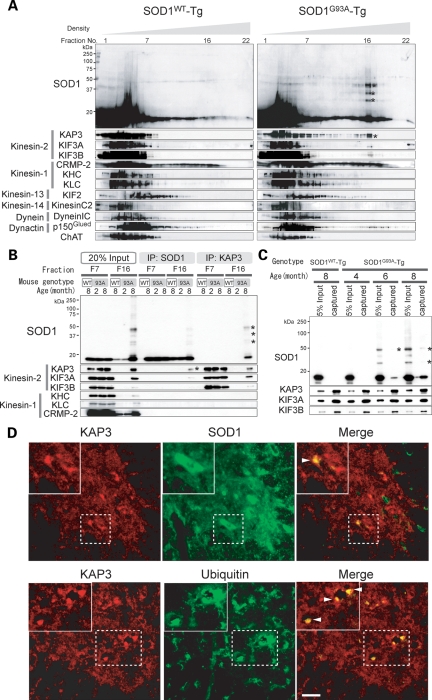
Figure 2.
Misfolded SOD1 species in ventral white matter of spinal cords specifically associates with KAP3. (A) Fractions obtained from Nycodenz density gradient centrifugation of ventral white matter of 8-month-old SOD1WT-Tg and SOD1G93A-Tg spinal cords were analyzed for the presence of indicated proteins (SOD1 and individual components of kinesin and dynein motor complexes) by immunoblot analysis. Each lane (left to right) represents an aliquot collected from the top. Note that misfolded SOD1 species (indicated by asterisks) migrated around fraction no. 16 in SOD1G93A-Tg spinal cords, where KAP3 co-migrated. (B) Immunoprecipitates of anti-SOD1 and KAP3 antibodies (indicated as ‘IP:SOD1’ or ‘IP:KAP3’) from Nycodenz density gradient centrifugation fractions 7 and 16 (F7, F16) of SOD1G93A-Tg mouse spinal cords prepared above were analyzed for the presence of indicated proteins by immunoblot analysis. Also shown is an immunoblot of samples F7 and F16 (20% of the amount used for immunoprecipitation) examined for expression of the same set of proteins. Note that misfolded SOD1–KAP3 association was detected from F16 but not from F7. (C) Immunoprecipitates of anti-KAP3 antibody from whole spinal cord extracts of 4-, 6- and 8-month-old SOD1G93A-Tg mice and 8-month-old SOD1WT-Tg mice were analyzed for the presence of misfolded SOD1 by immunoblot. KIF3A and KIF3B, which are kinesin-2 components, served as controls for immunoprecipitation. Note that misfolded SOD1 species (asterisks) were captured by anti-KAP3 antibody in 6-and 8-month-old SOD1G93A-Tg extracts. (D) Representative photographs of immunohistochemical co-localization of KAP3 and SOD1 (upper panel), and KAP3 and ubiquitin (lower panel) in a 9-month-old SOD1G93A-Tg mouse spinal cord. Insets show higher magnification images of boxed area. Arrowheads indicate aggregate-like structures within motor neuron cell bodies, which were positive for both KAP3 and SOD1 (upper panel) and KAP3 and ubiquitin (lower panel). Scale bars=50 µm.

