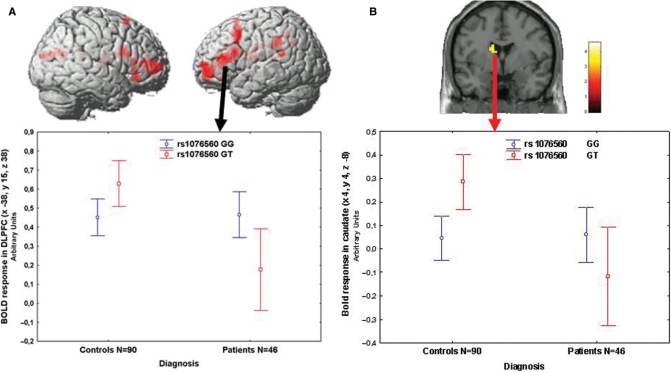
Fig. 2.
(A) 3D rendering (above, image thresholded at P < 0.005, uncorrected) and mean ± 0.95 CIs of BOLD response (below) of the interaction between diagnosis and rs1076560 genotype on WM prefrontal activity. (B) Coronal section (above) and mean ± 0.95 CIs of BOLD response (below) of the interaction between diagnosis and rs1076560 genotype on WM activity in the left head of the caudate.

