Fig. 3.
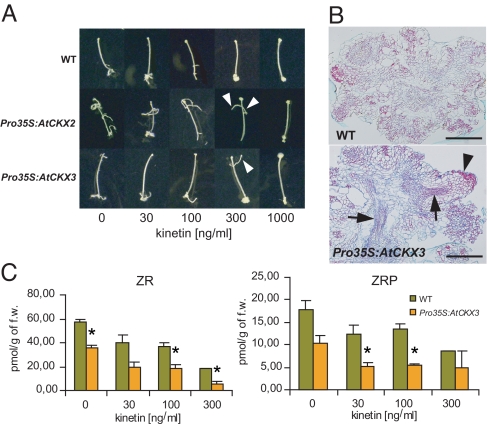
Auxin induces production of endogenous CKs that contribute to AIO. (A) Formation of root-like organs induced by NAA (537 nM). Note that in Pro35S:AtCKX2 and Pro35S:AtCKX3 lines, there are still root-like organs distinguishable even at the CK threshold concentration (arrowheads), which is not the case in WT. (B) Structure of calli induced by auxin (537 nM NAA) at the CK threshold (1.4 μM kinetin). In the Pro35S:AtCKX3 line, there are still patterned organs distinguishable (arrowhead) in comparison to WT, where only almost completely disorganized tissue could be detected. Arrows point to the patterned vascular tissue in Pro35S:AtCKX3 calli. (Scale bar: 200 μm.) (C) Levels of endogenous CKs after induction of organogenesis by NAA (537 nM) at different exogenous CK concentrations. The statistical significance of identified differences in comparison to WT (t test) at alpha 0.05 is designated (*); error bars show SDs. For the data on all analyzed CK metabolites, see Fig. S2 and Table S1.

