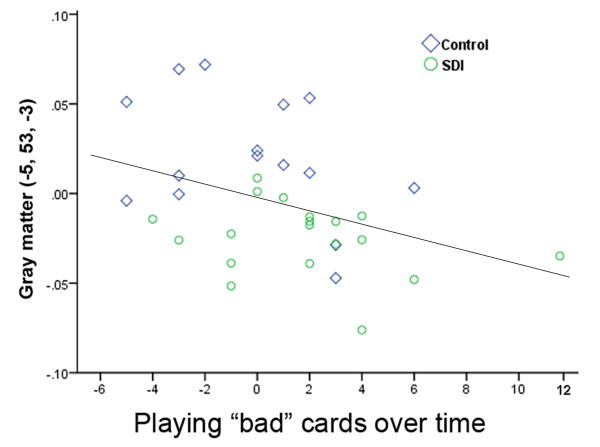
Figure 3.
Scatterplot of medial OFC gray matter volume (at -5, 53, -3), adjusted for total GM and age, and persistence in playing “bad” cards. A significant negative correlation was observed (r=-.39, p=.01 without controlling for IQ and education)(r=-.35, p=.03, after controlling for IQ and education).

