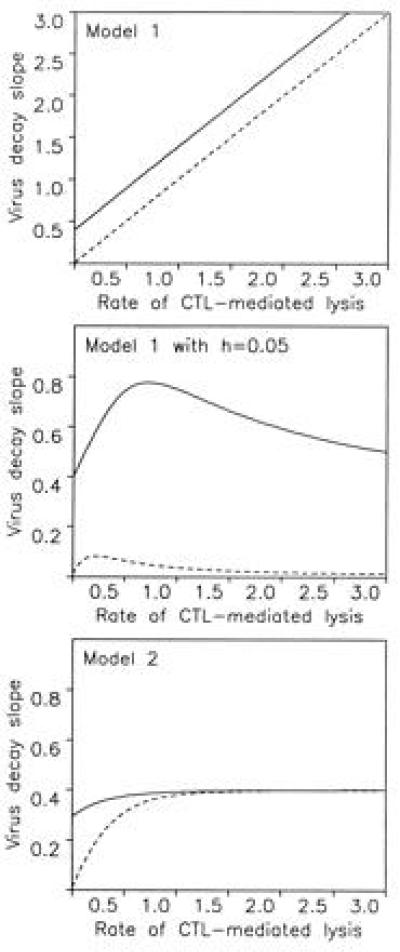
Figure 4.

The models provide a new interpretation of the slope of virus decay in drug treatment studies (1–6). We assume that before therapy, new infections occur at a constant rate β. This leads to an equilibrium distribution of y1, y2, and y3 cells and free virus v. Drug treatment reduces β to zero, which leads to a decay of free virus and infected cells. (A) In model 1, the equilibrium distribution of infected cells is y1(t) = 1 for t < t1, y2(t) = exp[−α(t − t1)] for t1 < t < t2, and y3(t) = exp[−α(t2 − t1) − (α + c)(t − t2)] for t2 < t, where t is the time since infection of the cell. Before drug treatment, the total amount of virus producing cells is Y3(0) = ∫t2∞ y3(t)dt = [1/(α + c)]exp[−a(t2 − t1)]. During drug treatment, this cell population declines as Y3(T) = Y3(0) for T < t2, and Y3(T) = Y3(0)exp[−(α + c)(T − t2)] for T > t2. Here T denotes time after start of drug treatment. Thus, virus decline occurs with a shoulder of length t2 followed by an exponential decline with slope α + c. (B) If we include a small fraction, h, of cells that are not exposed to CTL-mediated killing, the virus-producing cell population declines as Y3(T) = [(1 − h)/(α + c)]exp[−α(t2 − t1) − (α + c)(T − t2)] + (h/c)exp[−c(T − t2)]. In a patient with a weak CTL response (α ≈ 0), the exponential decline is c, and in a patient with a strong CTL response (α ≫ c), the decline is again roughly c. Thus, the rate of virus decline does not reflect the rate of CTL-mediated killing, α. (C) In model 2, virus-producing cells, Y3(T), decline as [(b − c)/a]e−at + [(α − a + c)/(α + b)]e−(α+b)t − [(α − a + b)/(α + c)]e−(α+c)t. This expression again describes an initial shoulder followed by an exponential decay. The slope of the exponential decay is determined by the smallest value among a, b + α, or c + α. If the rate, a, at which infected cells proceed to become targets for CTL killing is slow, then the exponential decay in treatment studies may simply reflect this process and not depend on the rate of CTL-mediated killing, α. In all models, free virus is produced from infected cells according to v̇ = kY3 − uv. If free virus turnover is fast, then v(T) is proportional to Y3(T) and the decline of Y3(T) can directly be interpreted as free virus decline; if not, then one more integration is necessary, but the conclusions are unaffected as long as u is not the slowest rate constant, which is very unlikely. For model 1, we chose c = 0.4, t1 = 0.5, t2 = 1, and h = 0.05. For model 2 we chose a = 0.4, b = 2, and c = 0.5 (continuous lines). Broken lines indicate noncytopathic virus with c = 0.01.
