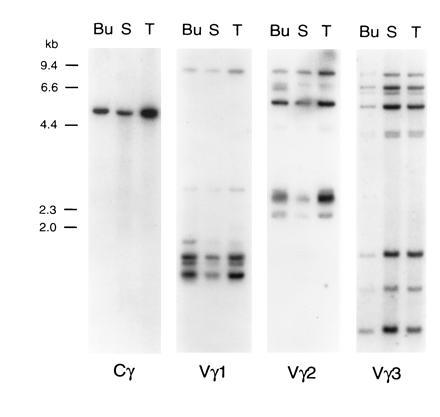
Figure 4.

Southern blot analysis of chicken genomic DNA with TCRγ constant and variable region probes. DNA (15 μg) from bursa (Bu), spleen (S), and thymus (T) was digested with the PstI restriction enzyme, electrophoresed in agarose, and blotted onto nylon membranes. Hybridization was performed with the Cγ probe and, after stripping, with Vγ1, Vγ2, and Vγ3 probes. Sizes of λ HindIII DNA marker fragments are indicated on the left. Digestion with EcoRI, XbaI, and HindIII restriction enzymes gave similar results (data not shown).
