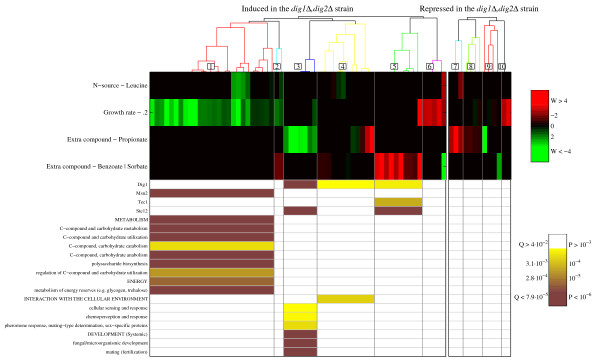
Figure 9.
Analysis of two groups: The genes upregulated in a dig1Δ, dig2Δ strain and the genes downregulated in this strain. Middle: Normalized regression weights for the significant cultivation parameters across the gene groups. Top: The genes were clustered based on these regression weights. Bottom: Schematic representation of the enrichment p-values and related false discovery rates (q-values) for each of the uncovered clusters when related to TF binding data and MIPS functional categories.

