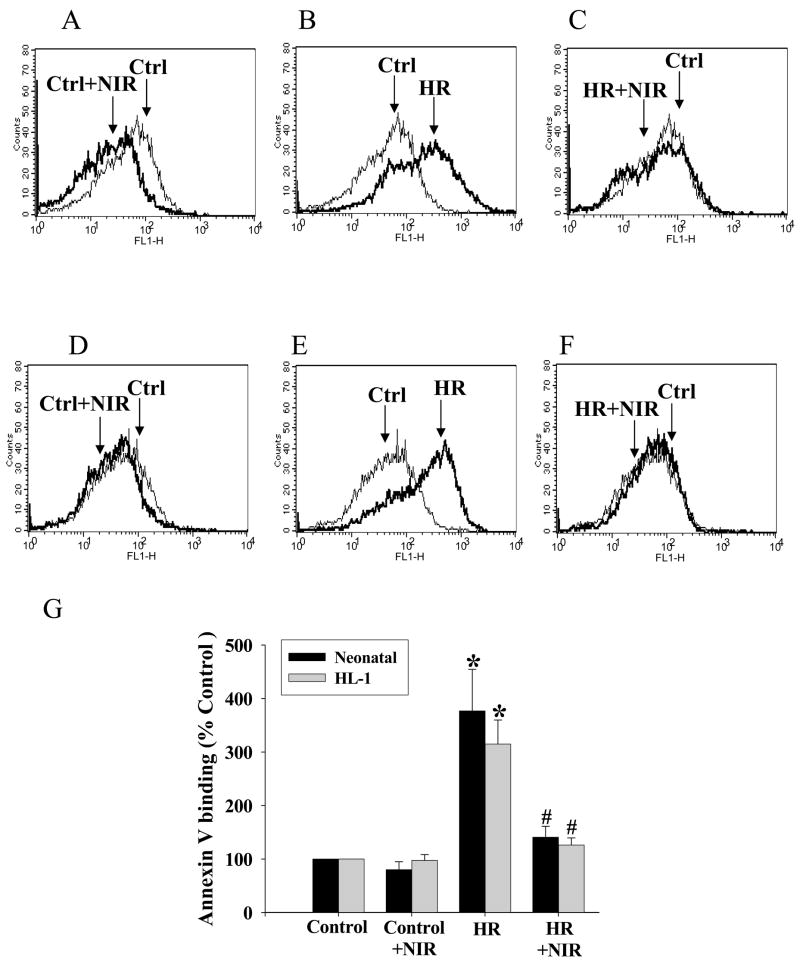
Figure 3. NIR decreases annexin V binding after HR.
Neonatal myocytes (A–C) and HL-1 cells (D–F) were subjected to normoxia or HR with or without treatment with NIR (7.5 J/cm2). Cells binding FITC-labeled annexin V were analyzed by flow cytometry as described in Materials and Methods. Graphs represent typical histograms comparing fluorescent intensity of control cells (traced in thin line) with control+NIR (A and D), HR (B and E) and HR+NIR (C and F) (traced in bold line). An increase in labeled cells after HR was noted, which was reversed by NIR. (G) Data summary illustrating % change of annexin V binding over control (100%). * p<0.01 vs. control, # p<0.01 vs. HR, n=4.

