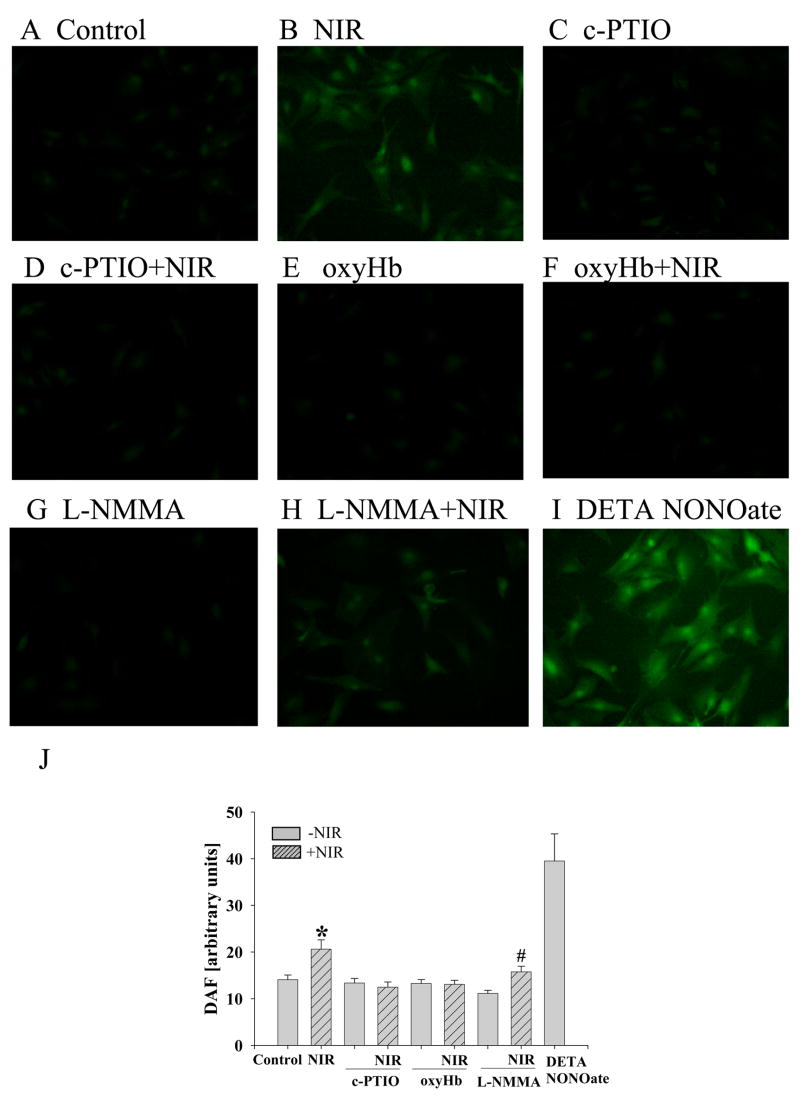
Figure 6. NIR increases NO level in cardiomyocytes.
The release of NO was measured after preloading cells with NO-indicator DAF-FM by fluorescence microscopy. Fluorescent images were examined 5 min after dye loading and washing-out (A) in untreated cells (control), or after exposure to (B) NIR (7.5 J/cm2), (C) c-PTIO, (D) c-PTIO+NIR, (E) oxyHb, (F) oxyHB+NIR, (G) L-NMMA, (H) L-NMMA+NIR and (I) DETA NONOate as positive control. (J) Data summary representing the average of DAF-FM fluorescence intensity (arbitrary units). * p<0.01 vs. control, # p<0.05 vs. NIR and L-NMMA without NIR, n=11–14 fields per treatment.

