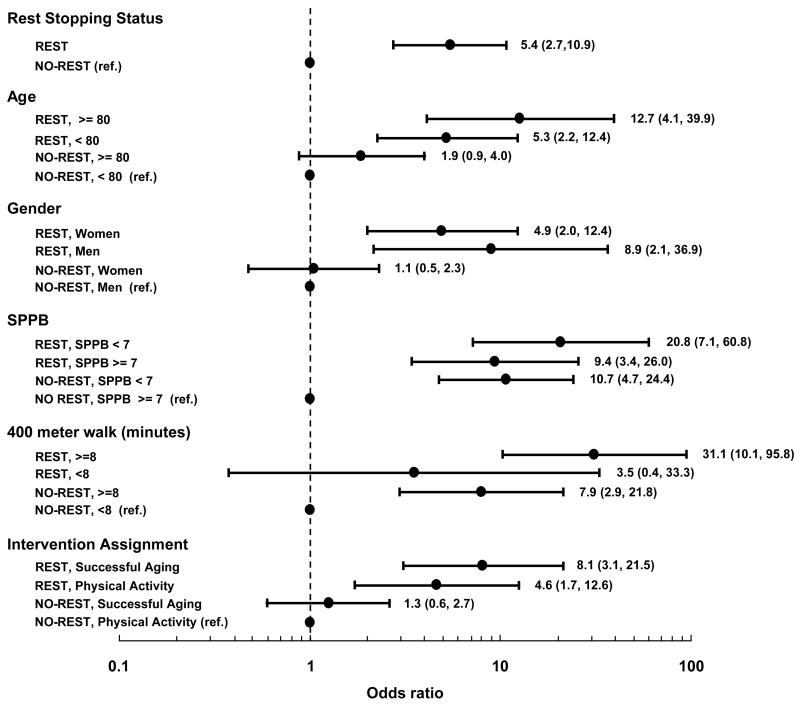
Figure 1.
Odds Ratios (95 % Confidence Intervals) for Mobility Disability at Follow-up According to Stratification by Rest Stop Status, Age, Gender, Performance in Short Physical Performance Battery (SPPB) and 400-Meter Walk, and Intervention Group Assignment. Note: The black circle and the horizontal lines correspond to odds ratio and 95% confidence interval. Adjusted for age, sex, and clinic examination site.

