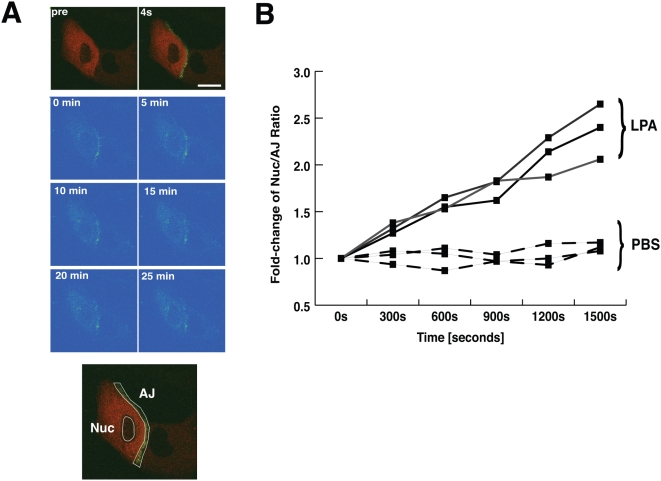
Figure 5. β-catenin from the cadherin-bound AJ pool translocates to the nucleus.
(A) β-catenin-ΔGSK-PA-GFP construct (green) was co-expressed in A431 cells with mRFP-actin (red). The AJ area was photo-activated selectively by 405 nm light using a Zeiss LSM510 confocal microscope (pre, pre-activation; 4 s, 4 sec after activation). The fluorescence of PA-GFP (green) was monitored at the indicated times, together with of mRFP-actin (red). One µM LPA stimulation images are shown in panel (PBS-treated cells not shown). The fluorescence levels of the nuclear (Nuc) and AJ areas (representative areas shown in bottom image) were measured over time using Zeiss LSM510 software. (B) LPA-stimulated cells exhibited a steady decrease of AJ expression, coupled with a steady increase of nuclear β-catenin expression, over time. In contrast, PBS-treated cells showed a steady level of nuclear β-catenin. Since cells displayed a wide variety of morphologies and initial fluorescence intensities per region, all measurements were normalized by plotting data as the fold-change of the fluorescence ratio (against corresponding measure for 0 h) of nuclear fluorescence/AJ fluorescence over time, for both PBS- and LPA-stimulated cells (N = 3). LPA-treated cells displayed significantly (P<0.05) increased levels of nuclear β-catenin over time, compared to PBS-treated control cells.

