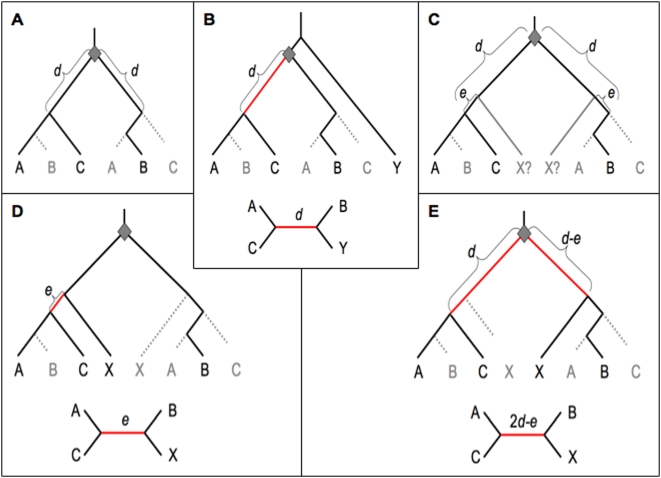
Figure 1. Differential loss of ancestral duplicates and gene trees with single outgroups, for different phylogenetic positions of the outgroup.
a) The general case in which duplication (grey diamond) followed by differential gene loss (dotted grey lines) leads to a closer relationship between gene copies from species A and C, in contrast to the species relationship. b) The case for a single pre-duplication outgroup Y. c) The general case for a post-duplication outgroup X diverged time e before the C/AB split. d) X and C retain the same duplicate copy. e) X and B retain the same duplicate copy. Both rooted and unrooted trees are shown. Red branches indicate the NST internal branch, supporting an A+C group.

