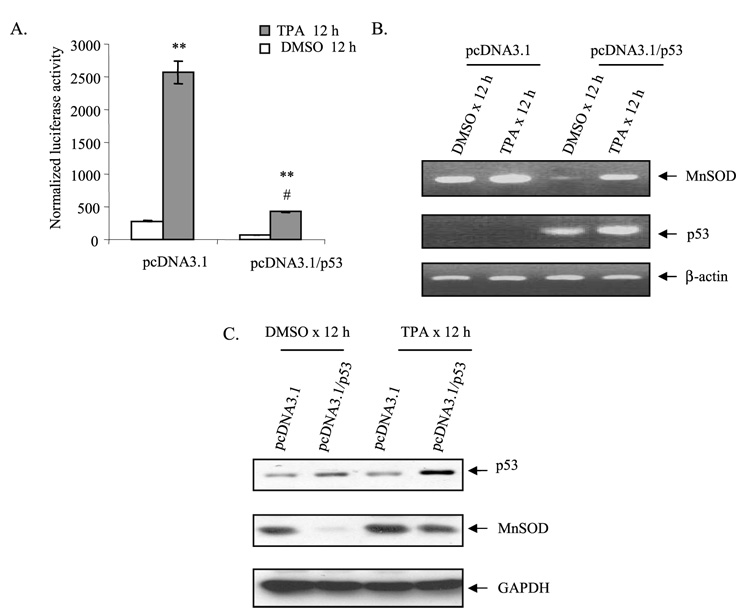
FIGURE 4. p53 overexpression suppresses MnSOD gene transcription.
HepG2 cells were co-transfected with either the p53 expression vector (pcDNA3.1/p53) or empty vector (pcDNA3.1) along with the MnSOD promoter (−555 to +24)-driven luciferase reporter vector. After 24 h of co-transfection, cells were split into separate dishes and grown for another 24 h before being treated with TPA (100 nm).DMSO,Me2SO. A, 12 h later, cells were collected for luciferase activity as a measure of MnSOD gene transcription. B, RT-PCR of RNA isolated from control and TPA-treated cells was carried out using primers for each specific gene as described under “Experimental Procedures.” C, Western analysis of MnSOD and p53. The membrane was stripped and re-probed with glyceraldehyde-3-phosphate dehydrogenase (GAPDH) antibody as the loading control. Statistical analyses were performed in three independent experiments **, p<0.01 compared with the control; #, p<0.01 compared with the corresponding treatment.

