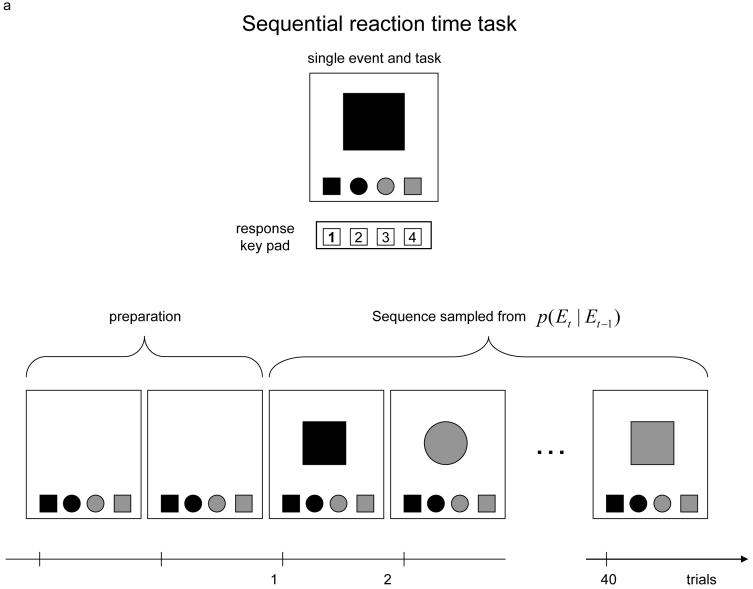
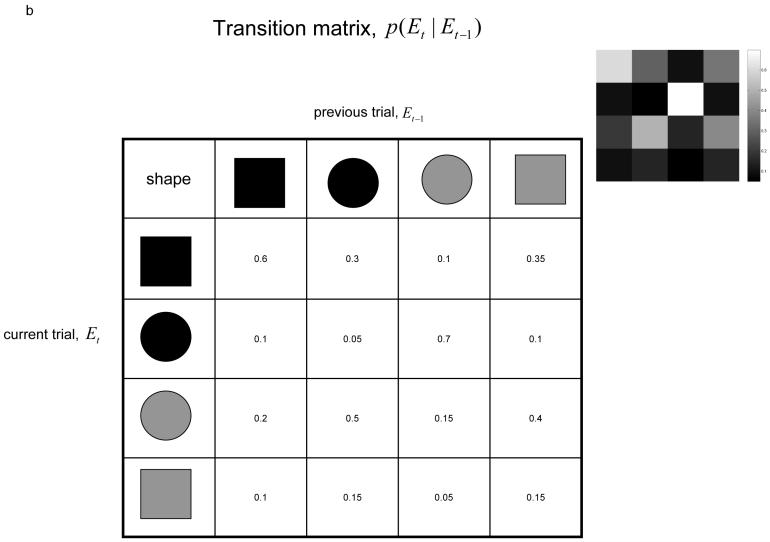
Figure 1.
(a) The four alternative choice reaction time paradigm. Subjects were required to press the key indicating the position of the target in the row beneath (indicated in the top figure by ‘1’ in bold type). Below is a schematic of samples displayed over one block. A row of possible targets was shown for 5 seconds before trials began. Each block consisted of 40 trials (first two and last one shown) with 12 blocks over the experiment. (b) An example of a transition matrix quantifying dependence among consecutive trials. The sequence of events produced by sampling from this distribution is an example of a 1st order Markov sequence. Gray-scale plot (top right) represents conditional probabilities.


