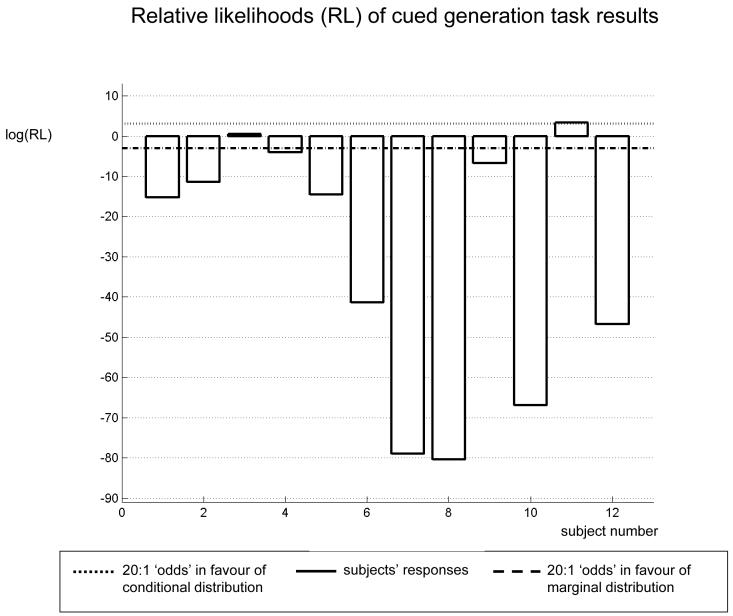
Figure 9.
Cued generation task. Bar plot of the logarithm of relative likelihood (RL) for each subject. The RL compares the likelihoods of 2 models (conditional and marginal) of subject responses. The upper and lower bounds correspond to 20 and 0.05 (i.e. ± log(20) ≈ ±3). This corresponds to 20:1 ‘odds’ in favor of the conditional and marginal model respectively.

