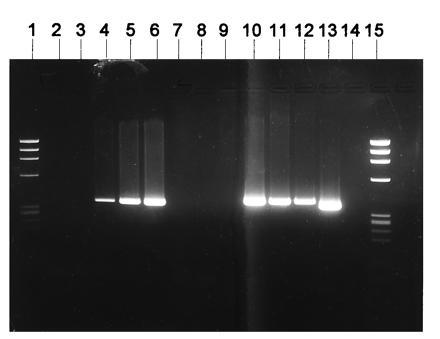
Figure 4.

DNA solution PCR analysis of marrow cells from patients transplanted with cells exposed to the stromal transduction method. Lanes: 1, Phi-X174 molecular weight markers; 2, negative buffer PCR control; 3–6, 100,000 K562 cells untransduced mixed with 0,5,20 and 100 K562 cells known to be positive for the vector MDR-1 sequences; 7–9, negative cells; 10 and 11, bone marrow cells from two breast cancer patients collected after transplantation with CD34+ cells exposed to the stromal MDR-1 vector transduction method (positive for MDR-1 vector sequences); 12, peripheral blood cells from one ovarian cancer patient collected after transplantation with CD34+ cells exposed to the stromal MDR-1 vector transduction method (positive for MDR-1 vector sequences); 13, positive control; 14, buffer PCR negative control; 15, Phi-X174 molecular weight markers.
