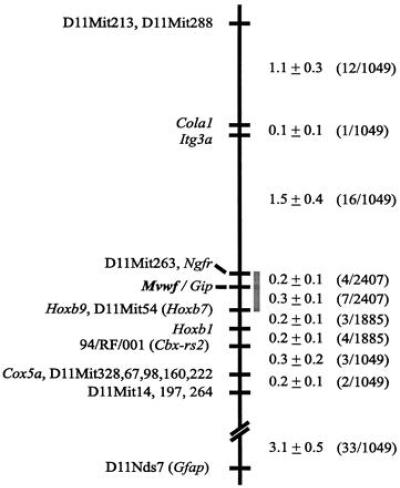
Figure 5.

Genetic map of a portion of distal mouse chromosome 11. Markers are indicated to the left and recombination fraction (% ± SD) to the right. At the far right is the fraction of recombinants among informative meioses (see Materials and Methods) in each interval. The gray bar indicates the Mvwf candidate interval.
