
Fig. 1. Adenovirus-mediated p75NTR transduction of EC promotes apoptosis via caspase-3 cleavage and stimulates the production of apoptotic microparticles from HUVEC.
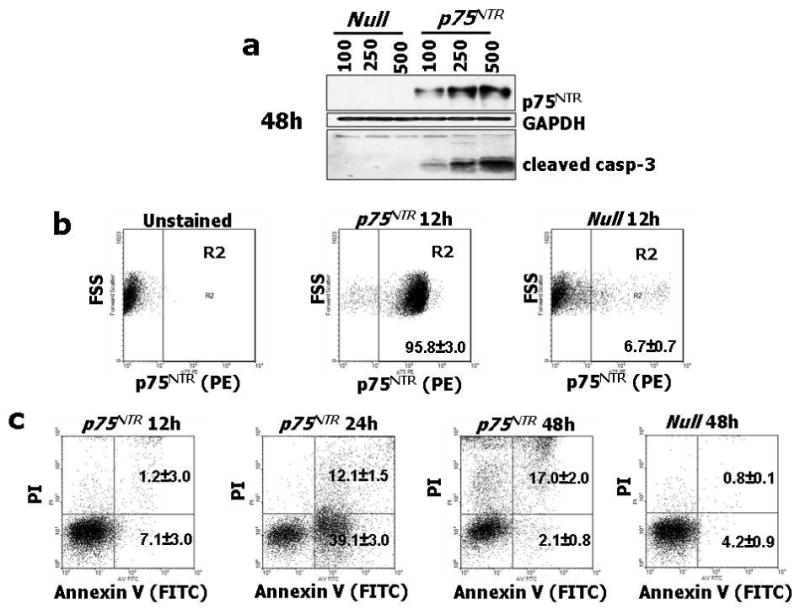
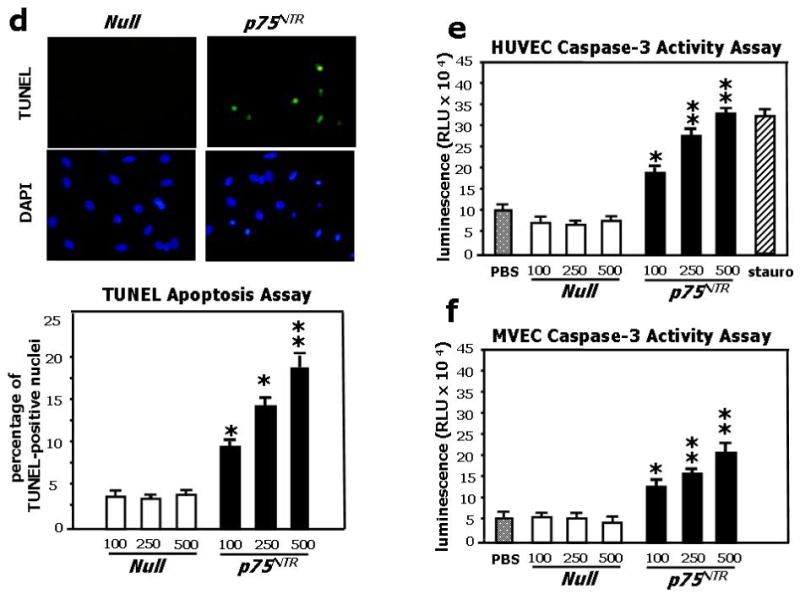


(a) HUVEC were infected with 100, 250 and 500 M.O.I. of Ad.Null or Ad.p75NTR, as indicated. After 48h, cell lysates were collected and subjected to western blotting with antibodies to p75NTR, cleaved caspase-3, and GAPDH (used as loading control). (b) FACS analyses for p75NTR show abundant receptor expression (95.8±3%) at 12h from gene transfer with Ad.p75NTR (250 M.O.I.), while at 12h from Null gene transfer, p75NTR-expressing HUVEC are only 6.7±0.7%. (c) p75NTR-expressing HUVEC were gated and studied at 12h, 24h, and 48h for co-expression with Annexin-V and propidium iodide (PI) to detect apoptosis. This analysis revealed that at 12h from Ad.p75NTR, less than 9% of p75NTR-carrying cells presented Annexin-V on the external plasma membrane. Early apoptosis (cells positive for Annexin-V and negative for PI, lower right squares) peaked at 24h (39.1±3% of p75NTR-expressing HUVEC), followed by late apoptosis (cells positive for both Annexin-V and PI, upper right squares) at 48h from Ad.p75NTR (17.05±2% of p75NTR-expressing HUVEC). (d) HUVEC were treated as described in (a) and apoptotic nuclei were detected by TUNEL assay. Fluorescent images are representative of apoptosis rate in Null-HUVEC and p75NTR-HUVEC. Bar graphs quantify apoptosis, which is expressed as percentage of TUNEL-positive nuclei (green fluorescence) to total nuclei (stained in blue fluorescence by DAPI). Data are presented as means±SEM. *P<0.05 and **P<0.001 vs. Ad.Null. (e,f) Caspase-3 activity assay was performed on HUVEC (e) or MVEC (f). Cells (5000 cells/well) were infected with 100, 250 or 500 M.O.I. of Ad.Null or Ad.p75NTR or left uninfected (PBS). After 48h, Caspase-Glo 3/7 was incubated for 1h before recording luminescence. The apoptosis inducer staurosporin (stauro, 1μM) was used as reference in (e). Values are means±SEM. *P<0.05 and **P<0.001 vs. Ad.Null. (g) Upper panel: Concentration of endothelial apoptotic microparticles (EMP) released by Null-HUVEC or p75NTR-HUVEC under no other stimulation or following incubation with the apoptosis inducer staurosporin (100 nM, 16h). Values are means±SEM. **P<0.01 vs. Ad.Null. Lower panel: p75NTR is present in EMP released by HUVEC. The shadow peak corresponds to fluorescence background obtained with the isotypic control of p75NTR antibody. The second peak represents the specific labelling of EMPs with fluorescent p75NTR antibody. (h) Caspase-3 activity assay performed on HUVEC infected with Ad.Null or Ad. p75NTR (each at 100 and 250 M.O.I.) before being treated with PBS, proNGF (5ng/mL), NGF (100ng/mL), or BDNF (100ng/mL) for 24h. Values are means±SEM. *P<0.01 vs. PBS.