
Fig. 3. p75NTR inhibits pro-angiogenesis and pro-survival pathways in EC and mouse limb muscles.
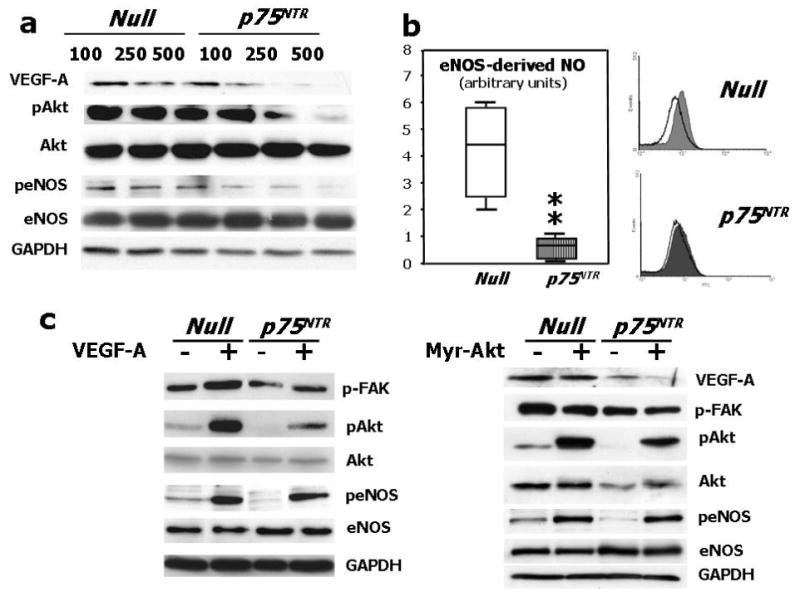
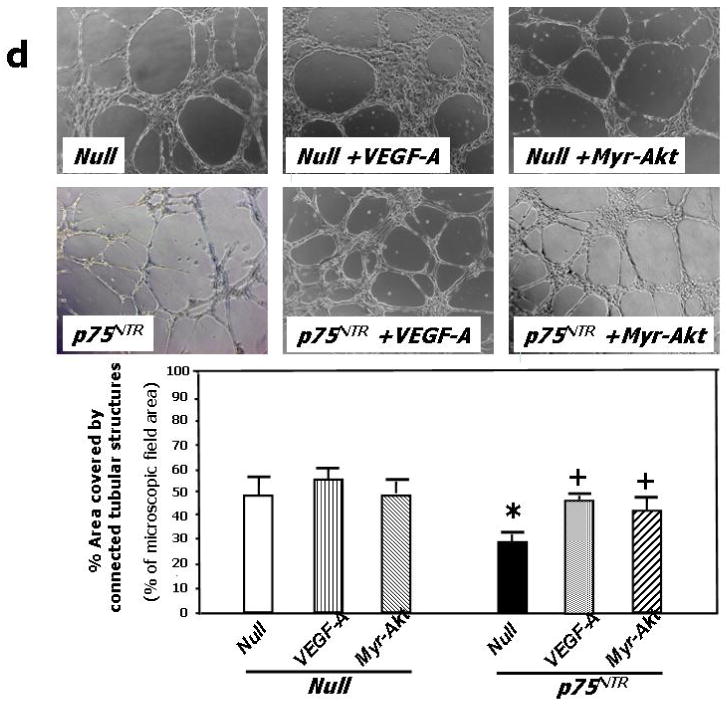
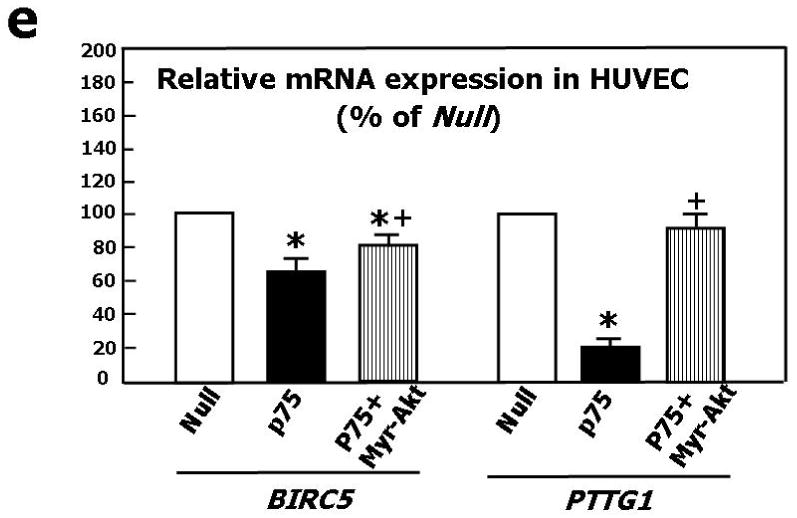
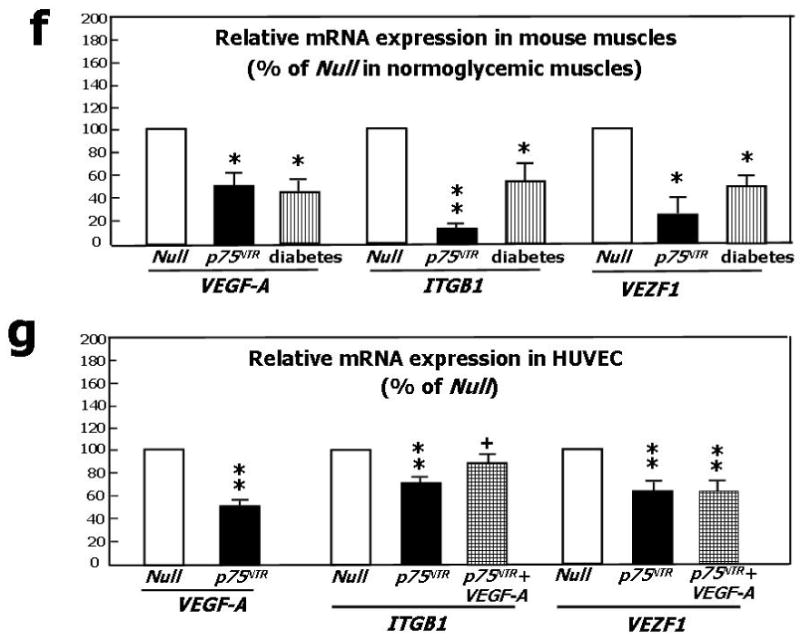
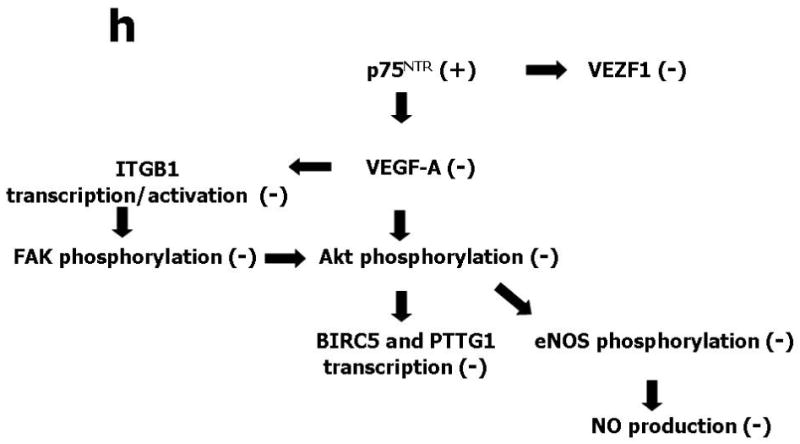
(a) Western blotting showing protein expression of VEGF-A, phospho-Akt, total Akt, phospho-eNOS, and total eNOS. GAPDH was used as loading control. HUVEC were infected with Ad.Null or Ad.p75NTR (100, 250, and 500 M.O.I.) and then lysated for western blotting. Bands are representative of three independent experiments. (b) HUVEC were infected with Ad.Null or Ad.p75NTR (250 M.O.I.). The release of NO was analyzed using the fluorescent probe DAF-2DA in the presence or absence of the eNOS preferential inhibitor L-NIO. FL1 fluorescence, emitted by DAF-2DA after reaction with NO, was determined by FACS. The bar graph shows the NOS-mediated FL1 mean fluorescence intensity after subtraction of eNOS-independent fluorescence emitted in presence of L-NIO. Representative histographs are shown on the right. Full curves are representative of NO release in the absence of L-NIO. Empty curves show NO release in the presence of L-NIO. Values in bar graph are means±SEM **P<0.01 vs. Ad.Null; (c) Left Panel: Protein expression of phospho-FAK, phospho-Akt, total Akt, phospo-eNOS, and total eNOS, in HUVEC infected with Ad.Null or Ad.p75NTR (each at 250 M.O.I.) plus Ad.VEGF-A or its control Ad.Null (each at 10 M.O.I.). GAPDH is used as a loading control. Bands are representative of three independent experiments. Right Panel: Protein expression of VEGF-A, phospho-FAK, total Akt, phospho-Akt, total eNOS, and phospo-eNOS in HUVEC infected with Ad.Null or Ad.p75NTR (each at 250 M.O.I.) plus Ad.Myr-Akt or its control Ad.Null (each at 100 M.O.I.). GAPDH is used as a loading control. Bands are representative of three independent experiments. (d) Both Ad.VEGF-A and Ad.Myr-Akt rescued tube formation capacity of p75NTR-transduced HUVEC. Cells were infected as described in (c) at 12h before being seeded in matrigel. Images were taken at 24h from seeding. Values in the quantification graph are means±SEM.* P<0.05 vs. Ad.Null plus Ad.Null, +P<0.05 vs. Ad.p75NTR plus Ad.Null. (e) Relative mRNA expression (determined by real-time RT-PCR, using RNA 18S as reference) of BIRC5 (survivin) and PTTG1 (securin) in p75NTR-HUVEC and Null-HUVEC. Co-infection with Myr-Akt enhanced BIRC5 and PTTG1 content of p75NTR-HUVEC. Values are means±SEM.* P<0.05 vs. Ad.Null, +P<0.05 vs. Ad.p75NTR. (f) Relative mRNA expression of VEGF-A, ITGB1, and VEZF1 in the adductor muscles of normoglycemic mice following its transduction with Null (Null) or p75NTR (p75NTR) and in Null-transduced diabetic limb muscles (diabetes). Values are means±SEM.*P<0.05 and **P<0.01 vs. Ad.Null in normoglycemic muscles. (g) Relative mRNA expression of VEGF-A, ITGB1, and VEZF1 in p75NTR-HUVEC and Null-HUVEC. Co-infection with VEGF-A rescued the mRNA level of ITGB1 but not of VEZF1 in p75NTR-HUVEC. Values are means±SEM.** P<0.01 vs. Ad.Null, +P<0.05 vs. Ad.p75NTR. (h) Schematic representation of the molecular signalling emanating from p75NTR in EC.