
Fig. 6. Inhibition of p75NTR signalling in diabetic limb muscles restores proper neovascularisation and BF recovery following limb ischemia.
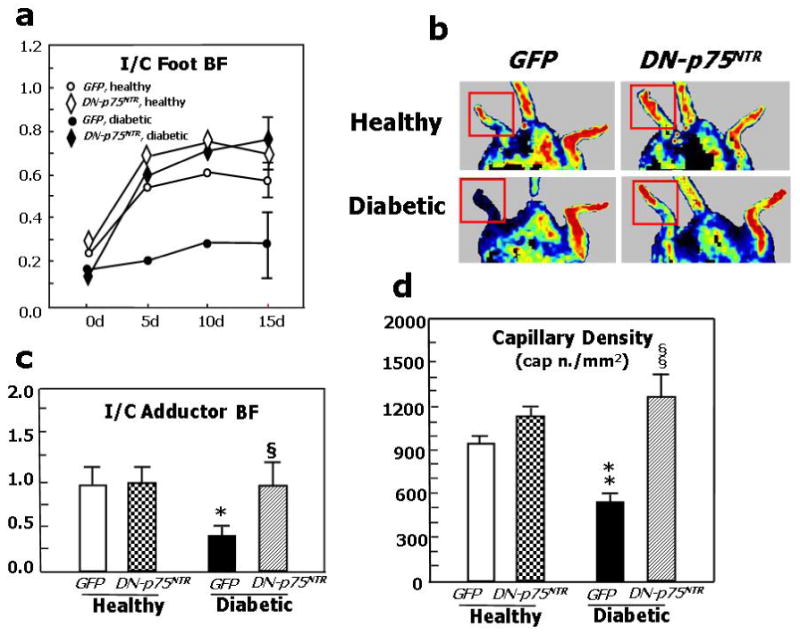
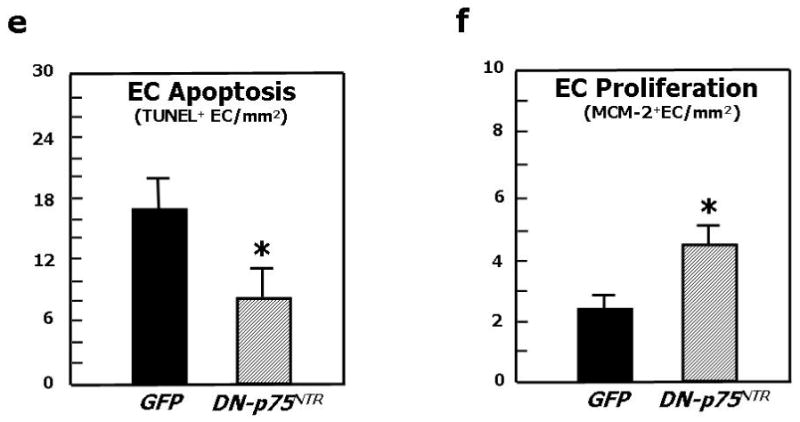
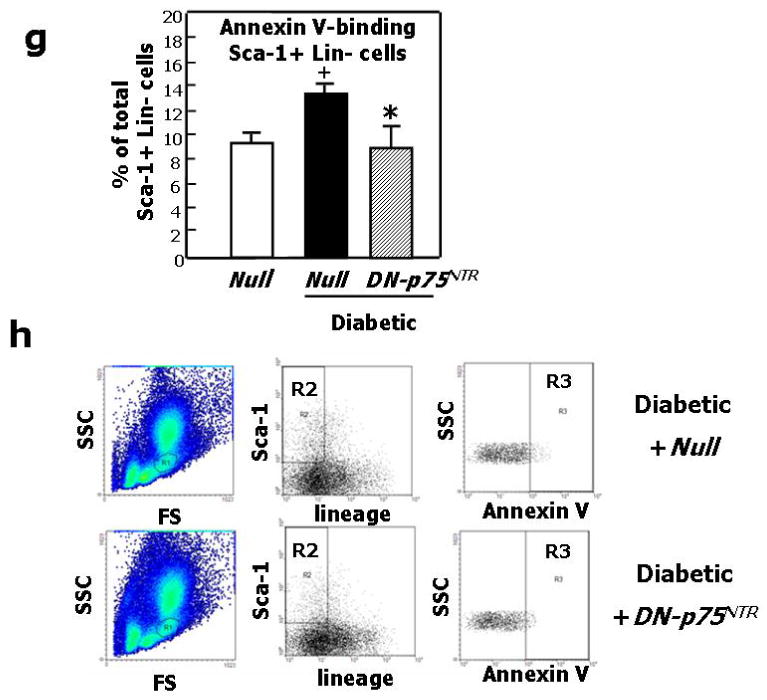
Unilateral limb ischemia was induced in diabetic and normoglycemic mice before an adenovirus carrying a dominant negative mutant of p75NTR (Ad.DN-p75NTR) or Ad.GFP was delivered to the ischemic adductor. (a) Time-course of post-ischemic BF recovery (calculated by laser colour doppler) in diabetics and normoglycemic mice treated with Ad.DN-p75NTR or Ad.GFP; (b) Representative laser Doppler images taken at 14d after induction of ischemia are shown. Squares include the area of interest; (c) Recovery of BF (measured by Oxford Optronic) to the ischemic adductor (expressed as the ration between BF in the ischemic to BF in the contra-lateral muscle) at 14d after ischemia induction. Values are mean±SEM. *P<0.05 vs. healthy with Ad.GFP, §P<0.05 versus diabetic with Ad.GFP. (d) Capillary density in the ischemic adductor at 14d post-ischemia. Values are means±SEM. **P<0.01 vs. healthy with Ad.GFP, §§P<0.05 vs. diabetic with Ad.GFP. (e) Apoptosis (revealed by TUNEL assay) and (f) proliferation (revealed by immunhistochemistry for the proliferation antigen MCM-2) of capillary EC in diabetic limb muscles at 14d post-ischemia induction. Values are means±SEM. *P<0.05 vs. Ad.GFP. (g) The percentage of BM-resident Sca-1+Lin- progenitor cells undergoing apoptosis (recognized by Annexin-V staining) is significantly reduced by intramuscular delivery of Ad.DN-p75NTR in diabetic mice. Values are means±SEM. +P<0.05 vs. healthy with Ad.Null.*P<0.05 vs. diabetic with Ad.Null. (h) Representative examples of FACS analyses of diabetic BM are shown. First, monocytic cells were identified by size/granularity (left panel), followed by selection of Sca-1+Lin- cells (R2, central panel). Finally, the percentage of cells positive for Annexin-V was calculated (R4, right panel).