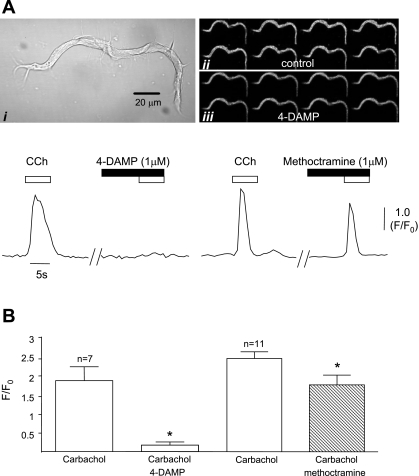
Fig. 3.
Ai: typical morphology of bladder interstitial cell. Aii–iii: time series fluorescence micrograph showing Ca2+ response to 1 μM carbachol which was blocked by the M3 antagonist 4-DAMP (1 μM). Traces show intensity time series of responses to carbachol and the effects of 4-DAMP and the M2 antagonist methoctramine (1 μM). Fluorescence (F) of an event is expressed as a ratio of background (F0). CCh, carbachol. B: graph summarizing the effect of 4-DAMP and methoctramine on 7 and 11 cells, respectively. *Statistical significance.

