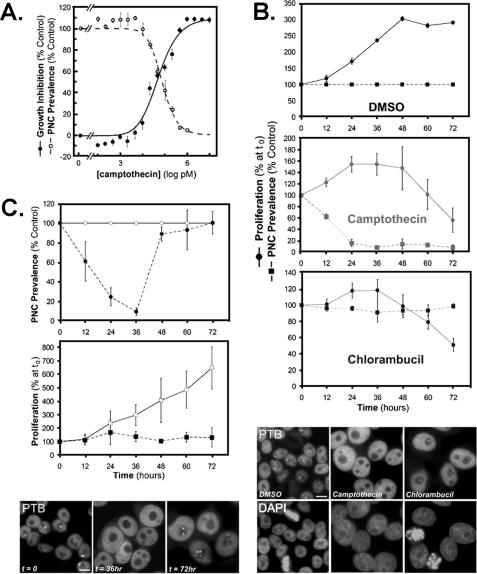
FIGURE 2.
PNC prevalence reduction by drugs is not due to cytotoxicity and is reversible. A, camptothecin-induced growth inhibition (•) and PNC prevalence reduction (○) at 72 h. PNC prevalence above 1 μm could not be counted because not enough cells remained on the coverslips for staining. Data were fit with one-site dose-response curves. B, top panel, PNC prevalence (▪) and proliferation (•) for vehicle-(1% DMSO), [GI99%] camptothecin-(294 nm), and [GI99%] chlorambucil (297 μm)-treated HeLa cells. Bottom panel, immunofluorescent staining against PTB to mark PNCs in HeLa cells at 72 h of treatment time. DMSO section shows absence of PTB staining in mitotic cells, and chlorambucil section shows the absence of PTB staining in apoptotic cells. C, top panel, PNC prevalence in HeLa cells treated with vehicle (○) and 294 nm camptothecin (•) for 36 h and then replaced with fresh media plus vehicle for 36 h. Middle panel, proliferation of HeLa cells treated with vehicle (□) and 294 nm camptothecin (▪) for 36 h and then replaced with fresh media for 36 h. Bottom panel, HeLa cells treated with camptothecin immunofluorescently stained for PTB at t = 0, 36, and 72 h to mark PNCs. Scale bars = 10 μm, and error bars = ±S.D. (n = 3). Proliferation was determined with the 3-(4,5-dimethylthiazol-2-yl)-5-(3-carboxymethoxyphenyl)-2-(4-sulfophenyl)-2H-tetrazolium, inner salt, assay described under “Materials and Methods.”

