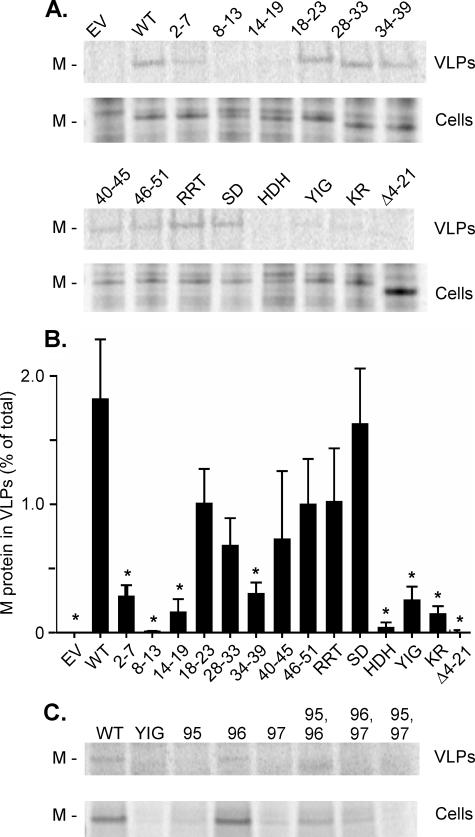
FIGURE 3.
Analysis of release of VLPs with wild-type and mutant M proteins. A, cells were transfected with plasmids encoding wild-type (WT) or the indicated mutant M proteins. Cells were continuously labeled with [35S]methionine, labeled VLPs were concentrated by centrifugation through a 15% sucrose cushion, and VLPs and cell lysates (Cells) were analyzed by SDS-PAGE and phosphorescence imaging. EV, empty vector. B, quantification of M protein in VLPs expressed as a percent of total cellular M protein. Data are presented as the averages of three separate experiments ± S.D. Statistical differences were determined using Student's t test. *, significantly different from wild-type (p < 0.05). C, analysis of release of VLPs with single and double mutations in the YIG sequence. VLP release was assayed as in A except that M proteins were immunoprecipitated from cell lysates before SDS-PAGE and phosphorimaging.

