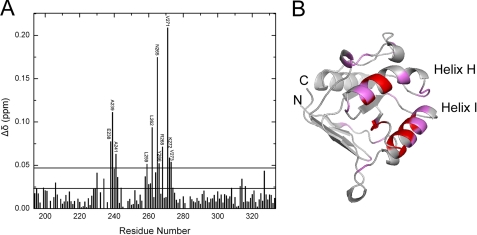
FIGURE 1.
A, summary of changes of the combined chemical shifts (Equation 3) observed for the apical domain in the absence and presence of SBP-W2DP6V. The lower line denotes the mean (0.022), and the upper line represents the mean plus one standard deviation (σ, 0.028) of data. B, mapping of the residues indicated in A on the structure of the apical domain. Residues with Δδ above the mean are colored in magenta, and those with Δδ above the mean plus one standard deviation are in red.

