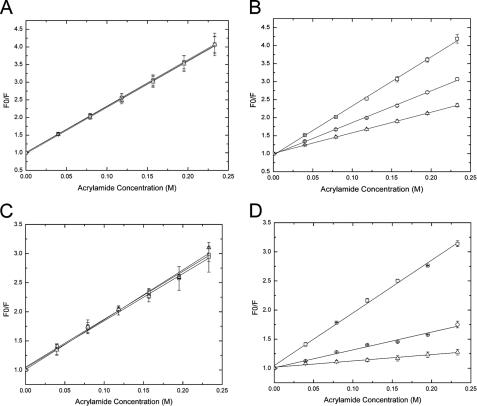
FIGURE 3.
Quenching of the peptide tryptophan fluorescence monitored at 360 nm by acrylamide. A, SBP-W2DP6V with and without the apical domain. B, SBP with and without the apical domain. C, SBP-W2DP6V with and without GroEL. D, SBP with and without GroEL. The peptide concentration was 20 μm. Squares, the peptide only; circles, peptide:protein = 1:1; triangles, peptide:protein = 1:5. Multiple independent experiments were carried out. The errors represent discrepancy among different runs and are shown along with the average values. The lines are linear fitting results of data.

