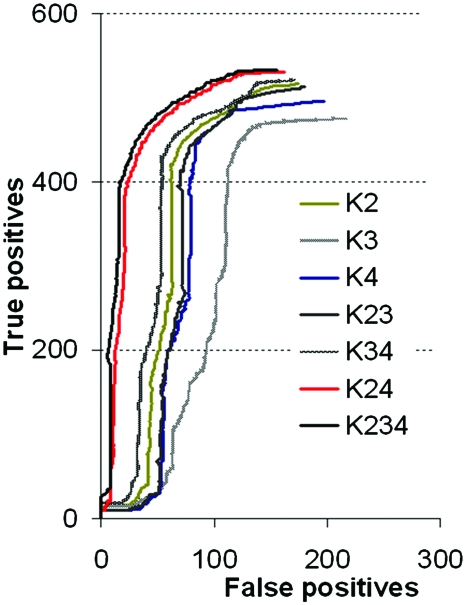
Figure 1. Kernel performance represented by their capacity to find known relationships between proteins (true positives) in comparison with the wrongly detected relationships (false positives).
K2: polynomial kernel constructed on the phylogenetic profiles; K3: Gaussian kernel constructed on the distance between genes on the chromosome; K4: Gaussian kernel constructed on the gene expression profiles from microarray data. The combination of kernels (i.e., K23) was done by the addition of each kernel: K2+K3.

