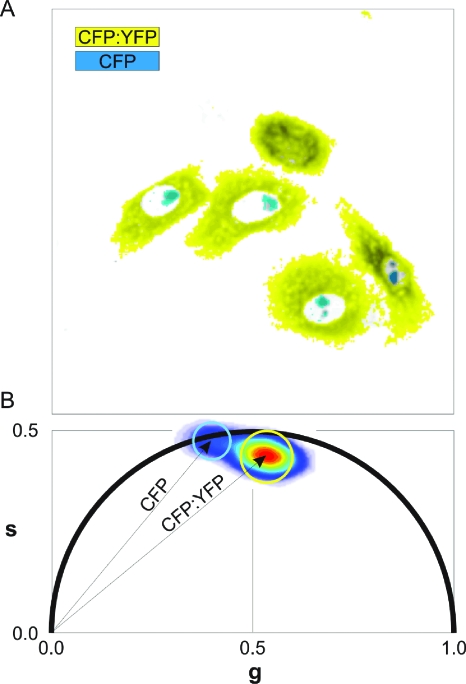
Figure 2. Segmentation (A) and polar plot representation (B) of the TCSPC data shown in Fig.1.
Cells were segmented according to the selections in the phasor space. Nucleolar regions and cytoplasm are shown in cyan and yellow, respectively, and overlaid with the intensity image. Note the precise selection of the nucleoli, and the exclusion of the remaining nuclear material containing mixtures of the lifetimes of both constructs that lie on the line connecting both pixel clouds.

