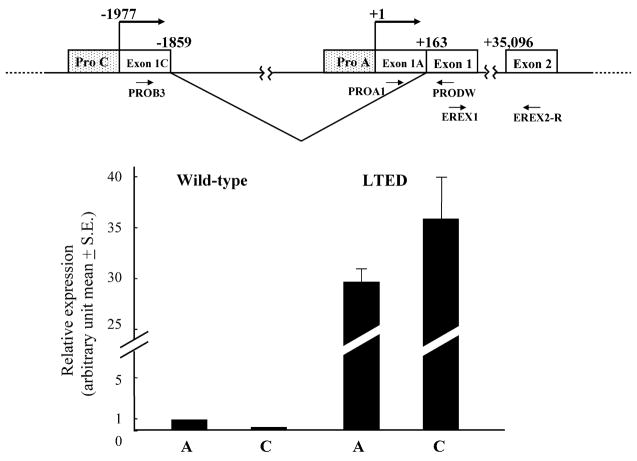
Fig. 2.
Expression of ERα mRNA transcribed from promoters A and C in wild-type and LTED cells. Schematic representation of a part of ERα gene organization is shown above. The transcription start site of promoter A is defined as +1. Relative expression of ERα mRNA from promoters A and C in wild-type and LTED cells is shown. Expression levels of ERα mRNA from promoters A and C were quantified by real-time RT-PCR as described in Section 2 being normalized by β-actin mRNA.

