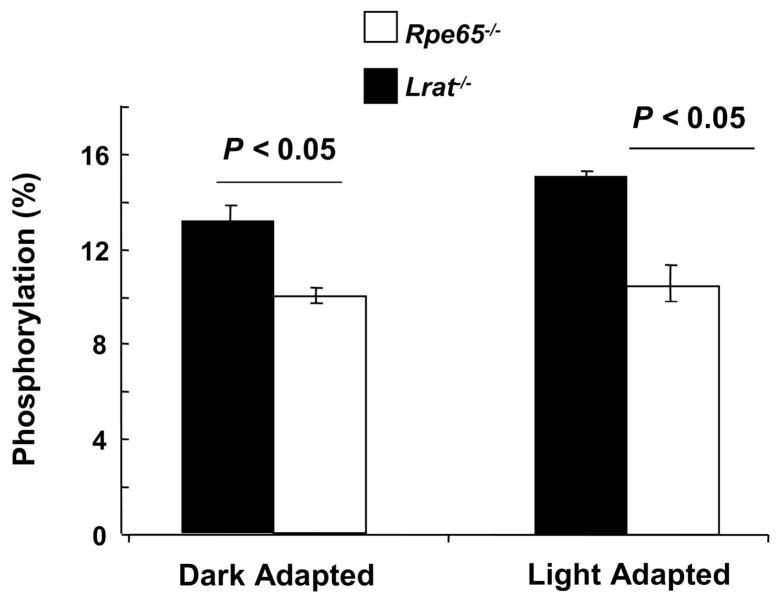
Figure 3. Opsin phosphorylation levels in Lrat−/− and Rpe65−/− mice.
Retinae of 2-month-old Rpe65−/− and Lrat−/− mice were homogenized in 8 M urea and the pellet digested with Asp-N to cleave the opsin C-terminus. The peptides were analyzed by HPLC/MS/MS using a LTQ mass spectrometer. Data are presented as percentages of phosphorylated peptides (means ±SEM (n = 3)) and analyzed by the two-tailed Student t test, accepting a significant value of P <0.05. White bars: Rpe65−/− mice; black bars: Lrat−/− mice.

