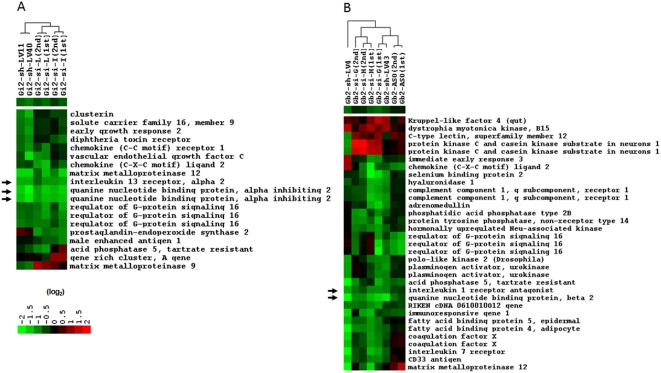
Figure 2. Hierarchically clustered dendrograms of gene expression changes.
Clustering was achieved using the CLUSTER and TREEVIEW programs (http://rana.lbl.gov/EisenSoftware.htm). Each row represents a gene, and each column represents a particular sample. (A) Gαi2 gene knockdown (LV40 and LV11: shRNA- expressing lentivirus transfected cell lines; I and L: I or L form of siRNA transfected into cells). (B) Gβ2 gene knockdown (LV4 and LV43: shRNA-expressing lentivirus transfected cell lines; G and H: G or H form of siRNA transfected into cells; Gb2-ASO: antisense oligonucleotide). The expression level relative to that of the control cells is provided by colors shown in log2 scale. The target genes, Gαi2 and Gβ2, are highlighted by arrows. The apparent down-regulation of IL13ra2 in the Gαi2-deficient cells and IL1rn in the Gβ2-deficient cells are also highlighted (see context).

