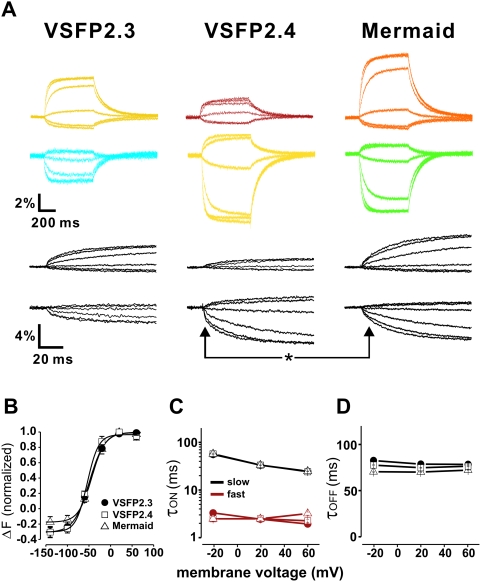
Figure 3. Characterization of voltage dependency and kinetics of VSFP2.1 variants.
(a) Acceptor (upper color traces) and donor (lower color traces) signals in response to a family of 500 ms voltage steps from a holding potential of −70 mV to test potentials of −140 mV to +60 mV at 35°C. Black traces are the initial responses at expanded time scale. (b) ΔF-voltage relationship of VSFP2.3 acceptor (half maximal response (V1/2) = −49.5 mV, n = 10), VSFP2.4 donor (V1/2 = −54.2 mV, n = 10) and Mermaid acceptor signals (V1/2 = −43.6 mV, n = 10). (c–d) Voltage dependency of fast and slow components of τon and τoff.

