
Figure 5. Real time qPCR analysis of gene expression.
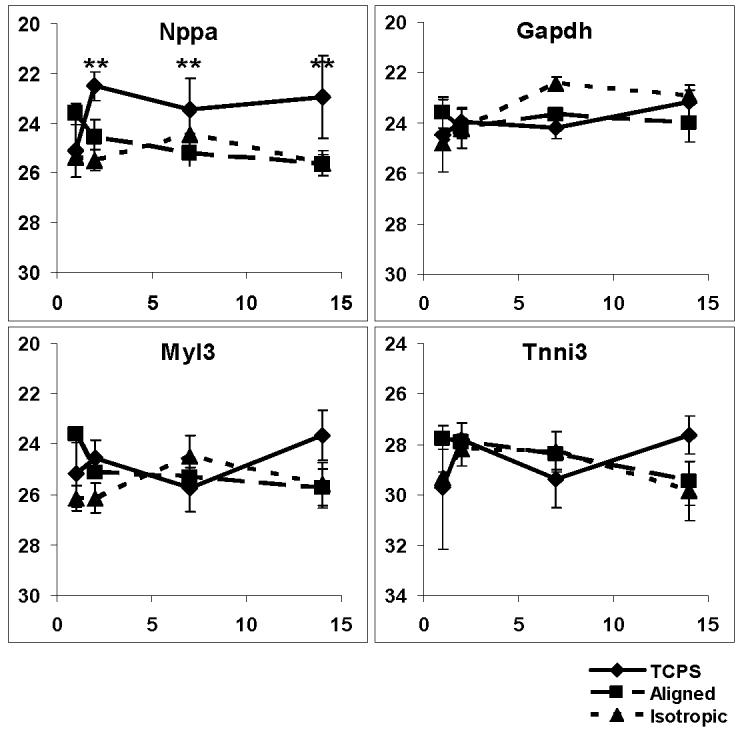
Steady state mRNA levels for primary cardiac cells cultured for 1, 2, 7, and 14 days are shown. Note that Ct values on the y-axis are in reverse order because a lower Ct indicates higher expression. Asterisks indicate statistically significant differences (p<0.05) at the given day based on 2-Way ANOVA with a Tukey-HSD post-hoc test. Nppa expression was found to be significantly elevated in TCPS based cultures over ES-PU cultures. Gapdh, Tnni3, and Myl3 levels were each similar across the different culture types.