
Figure 6. Assessment of immunoreactive ANP.
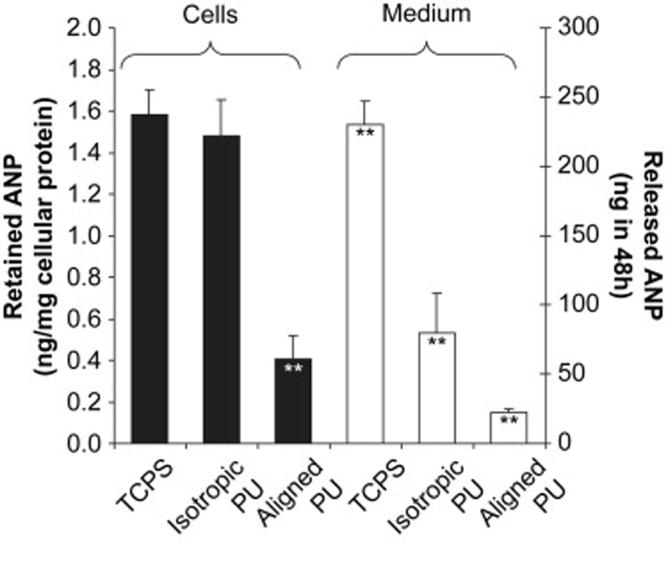
Analysis of ANP levels detected by immunoassay at day 7 of culture shows that cells on aligned ES-PU had lower steady state ANP levels than cells plated on either TCPS or isotropic ES-PU mats (p < 0.05 by ANOVA with post-hoc Tukey-HSD) and that cells plated on aligned ES-PU released significantly less ANP in the 48 hours preceding collection than cells on isotropic ES-PU, which released significantly less than cells on TCPS (p < 0.05). Data are mean ± SD, n=3. Asterisks denote that a significant difference was found relative to both remaining samples. Note that the data indicate the combined levels of ANP, pro-ANP, and pre-pro-ANP.