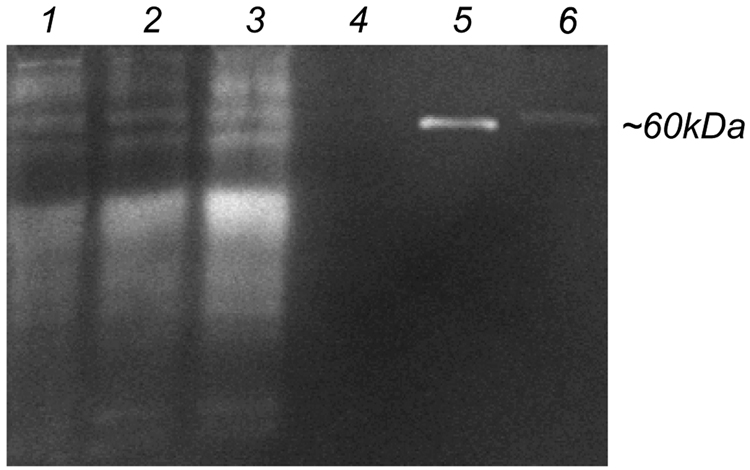
Figure 5.
Zymogram gel electrophoresis of D1 cell conditioned medium at passage 3 (lane 1), 6 (lane 2) and 10 (lane 3). BSA (lane 4), 10 ng MMP-2 (lane 5) and DMEM with 10% serum (lane 6) were run for comparison. All conditioned medium samples as well as BSA and DMEM were run at a total protein concentration of 27 µg as determined by Bradford assay.

