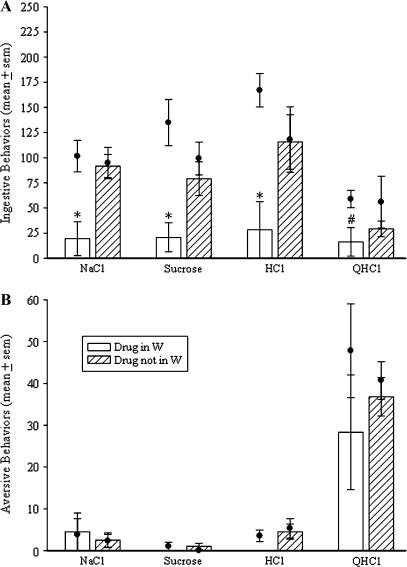
Figure 4.
Effects of reverse microdialysis of CNQX into W (n = 4) compared with the effects of the delivery of CNQX within the PBN but outside of W (n = 6) on ingestive (A) and aversive (B) taste reactivity behaviors. Each bar indicates the mean (±standard error of the mean [SEM]) number of behaviors performed during 1 min of intraoral infusion of 0.1 M NaCl, 0.1 M sucrose, 0.03 M HCl, and 0.003 M QHCl. Each dot indicates the mean (±SEM) number of behaviors performed during 1 min intraoral infusions of the same tastants before drug delivery (baseline). Asterisks indicate a significant difference from baseline as well as from the behaviors performed by the rats in which CNQX was delivered outside of W. The pound sign indicates a significant difference from baseline but not the other group of rats (P < 0.05, Student's t-test).

