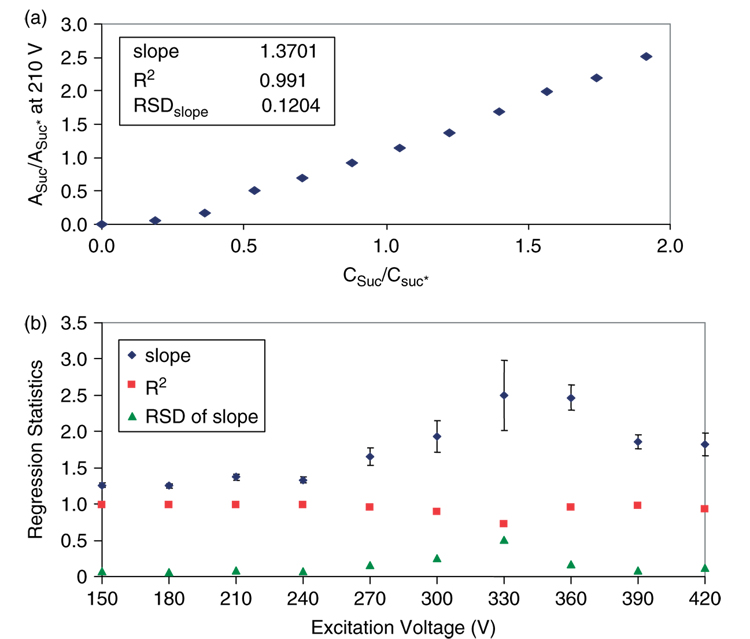
Figure 2.
(a) Representative plot of abundance ratios (Asuc/Asuc*) versus concentration ratios (Csuc/Csuc*) of labeled to unlabeled sucrose (excitation voltage of 210 V). (b) Regression statistics from graphs like (a) were plotted against the excitation voltage range studied to determine the optimum excitation voltage range for quantifying carbohydrates with MALDI-FT-ICR-MS.

