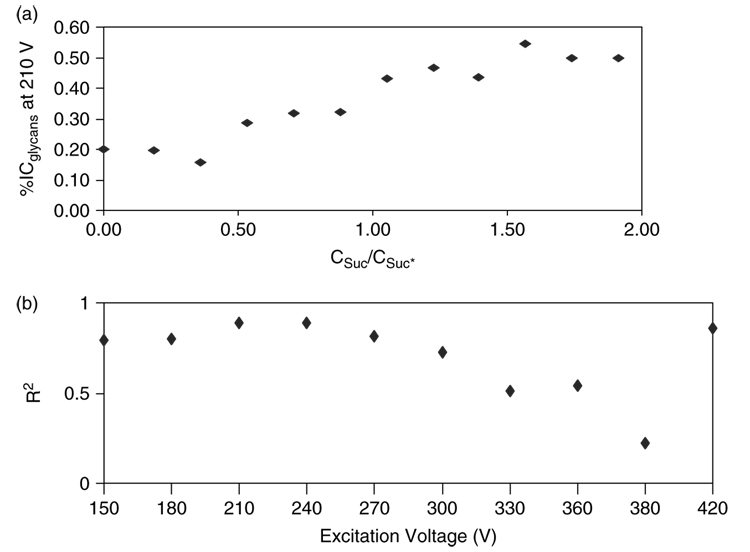
Figure 3.
Determination of the optimum excitation voltage for the analysis of oligosaccharides by MALDI-FT-ICR-MS. (a) Plot of percent (%) ion composition of sugar analytes against concentration ratios (Csuc/Csuc*) for labeled and unlabeled sucrose at 210 V excitation voltage. (b) The R2 values determined from plots like (a) over a range of excitation voltages were graphed against the excitation voltage range studied.

