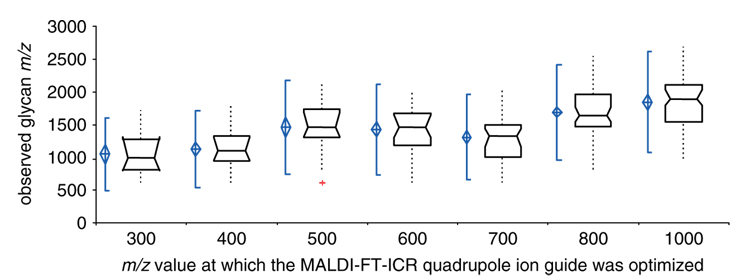
Figure 4.
Box and whisker plot of m/z range of glycan peaks detected with the quadrupole ion guide optimized at increasing, specific m/z values. Acquiring MS data with optimization at m/z 400 and 900 (data point not shown, but similar to optimization at m/z 1000) enabled the examination of most of the O-glycan peaks from mucin.

