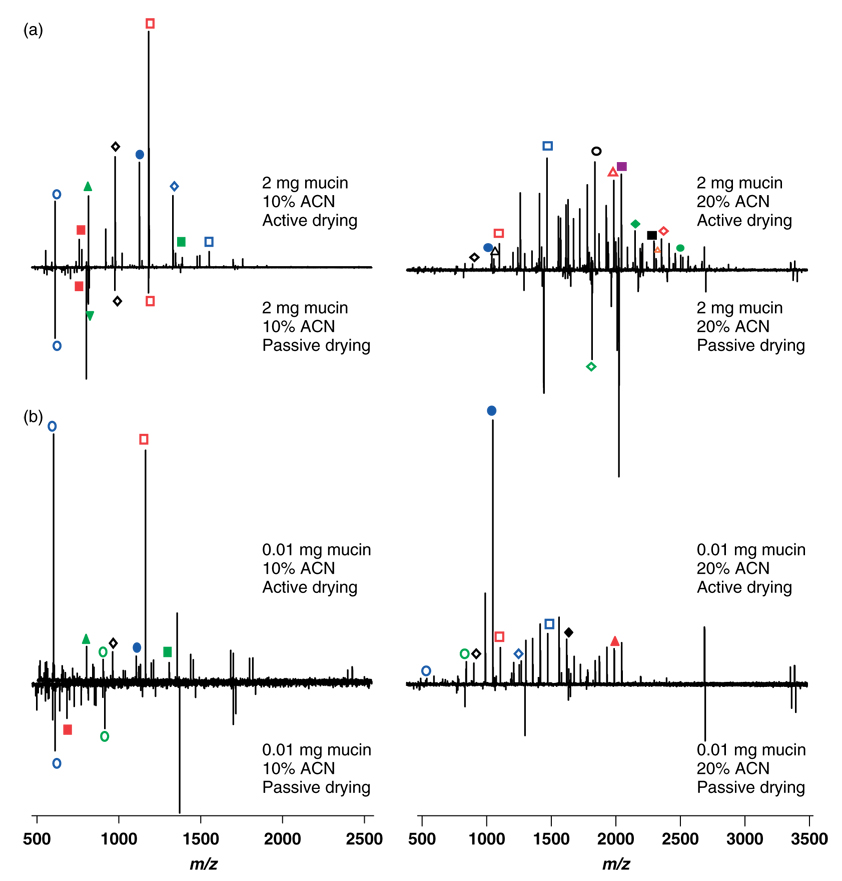
Figure 5.
Mass spectra of glycans from (a) 2 mg and (b) 0.01 mg (LOD) mucin starting glycoprotein mass. Active drying (AD) and passive drying (PD) sample spotting techniques were compared. Mass spectra were acquired from carbohydrates from the 10 and 20% ACN fractions with the quadrupole ion guide optimized at m/z of 400 and 900, respectively.

