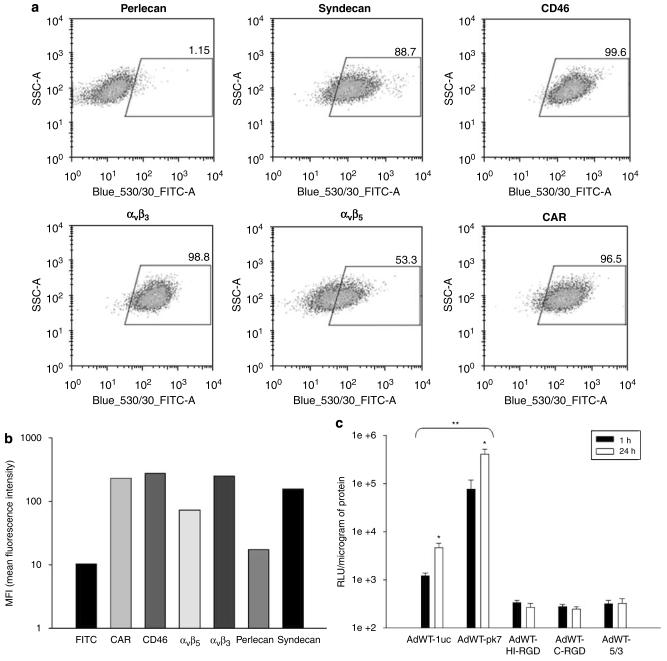
Figure 2.
NSCs express adenoviral target receptors and permit efficient gene transduction by recombinant adenoviral vectors. (a) Flow cytometric analysis of surface receptors targeted by recombinant adenovirus vectors. Dot plots represent the percentage of cells undergoing shifts in fluorescence intensity. (b) Bar graph representing average MFI values (y-axis) for each adenoviral receptor (x-axis). (c) Transduction of NSCs with recombinant Ad vectors was analyzed by luciferase activity. The level of transduction with each vector (x-axis) is represented on the y-axis as relative light units (RLUs)/mg protein. *P-value <0.05 vs time; **P-value <0.05 vs AdWT.

