Figure 4.
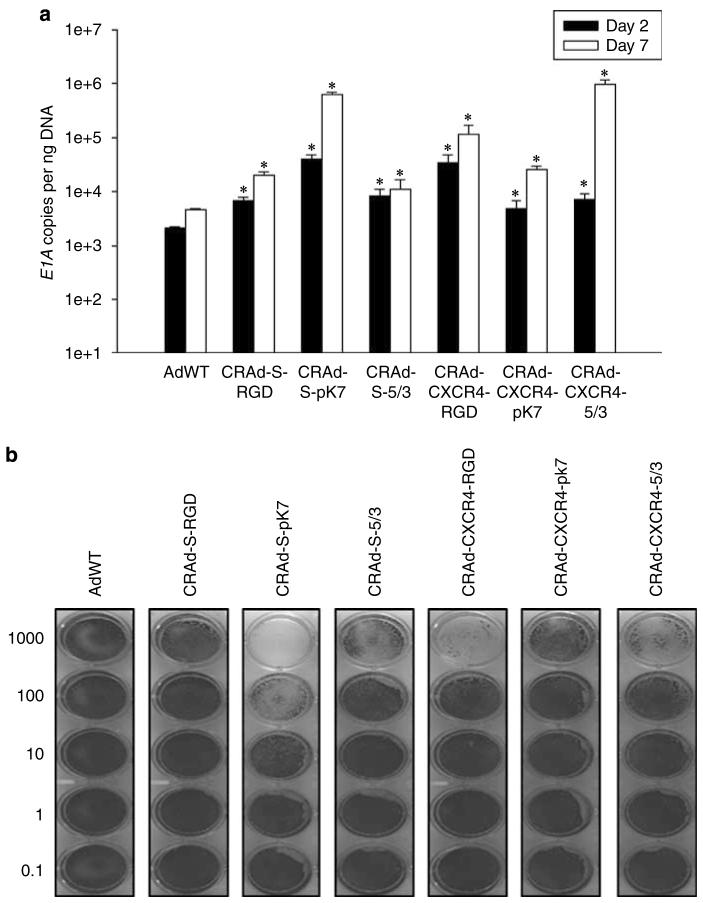
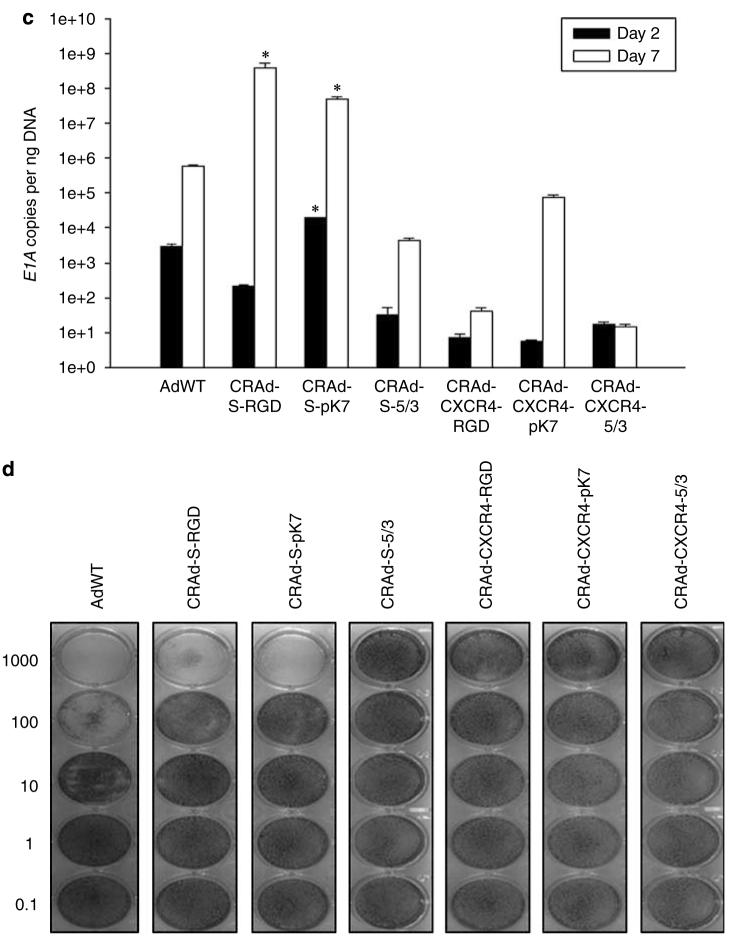
Replication and cytotoxicity profiles of oncolytic adenoviral vectors in U87MG and NSCs. The replicative capacity of each indicated vector was measured using quantitative RT-PCR. The extent of genome amplification in each cell type was determined by measuring the number of viral E1A copy numbers per nanogram of DNA. Genome amplification was quantified at 2 days (black bars) and 7 days (white bars) after initial infection with each vector in U87MG (a) or NSCs (c). The cytotoxicity of each viral vector was also assessed in U87MG (b) or NSCs (d) using crystal violet staining of cell monolayers. Cells were infected with each vector at the indicated doses (1000–0.1 vp (viral particles) per cell), and the degree of cell monolayer confluency was assessed 10 days after the day of infection. Cell lysis and consequent monolayer disruption are indicated by transparent regions in a well, whereas a lack of replicative cytotoxicity is indicated by a monolayer of cells that stain dark and appear opaque. *P-value <0.05 vs AdWT.


