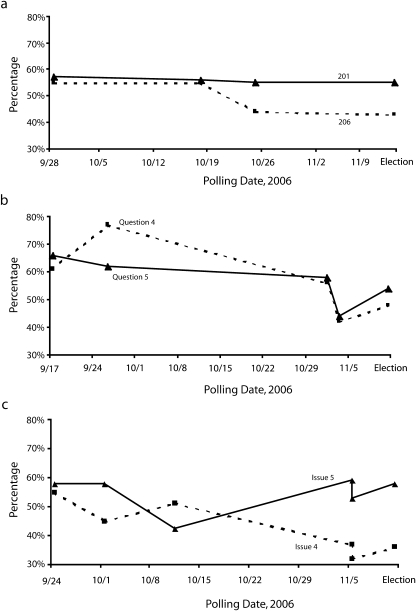
FIGURE 2.
Polling and election results for competing antismoking initiatives in (a) Arizona, (b) Nevada, and (c) Ohio in 2006.
Note. Health group campaigns are represented by solid lines and pro-tobacco campaigns by dotted lines. Polls in September 2006 showed the competing initiatives in all 3 states passing. As the campaigns progressed, support for the health group campaigns stayed consistent while support for the pro-tobacco campaigns eroded.
Source. For Arizona data, see references 39–42; for Nevada data, see references 42–45; for Ohio data, see references 46–50.

