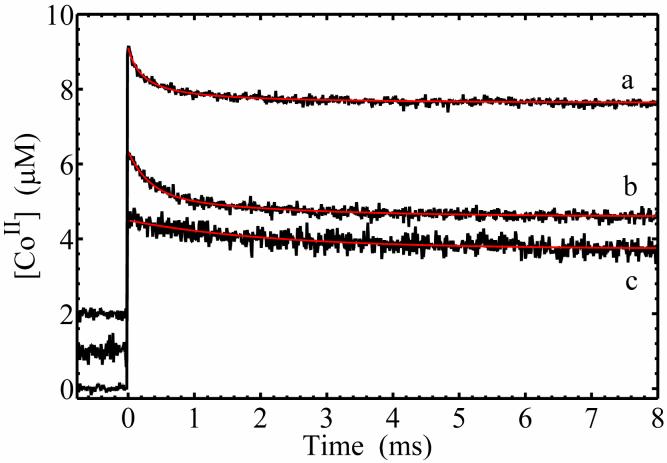
Figure 4.
Time dependence of cob(II)alamin concentration following pulsed laser photolysis of AdoCbl, and overlaid best-fit functions (red). Cob(II)alamin concentration was obtained from the absorbance at 470 nm. (a) Anaerobic solution; second-order plus constant fit function. (b) In EAL in aerobic solution; biexponential plus constant fit function. (c) In EAL in aerobic solution, with (S)-1-amino-2-propanol bound; monoexponential plus constant fit function The decay has been multiplied by a factor of 2.0 to account for the two-fold higher concentration AdoCbl in (b) relative to (c). The fitting parameters are presented in Table 2.

