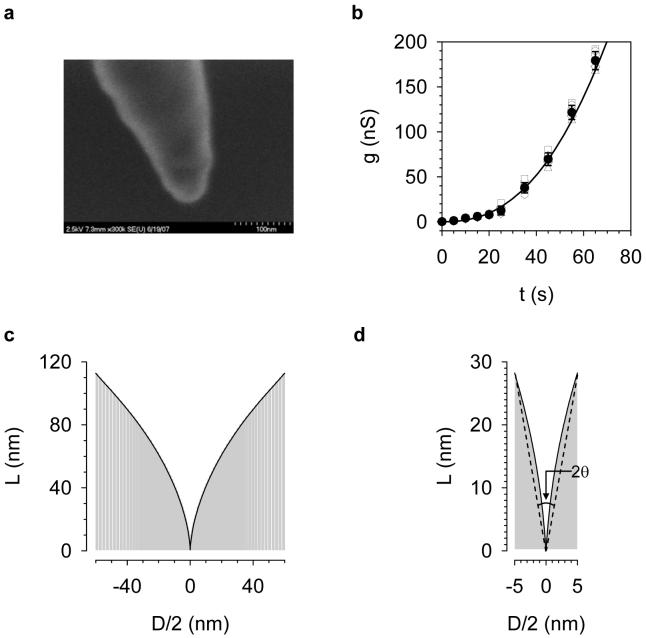
Figure 2.
Detection of nanocavity profile. a. SEM image of a nanopore-templated polydimethylsiloxane (PDMS) nanowire coated with a 3-nm platinum layer. The liquid PDMS, which has been vacuumed to remove the bubbles, was injected into the micropipette, followed by spinning in a microcentrifuge at 10,000 rpm for 2 minutes to deliver the polymer to the cavity end. After curing at 90 °C for 4 hours, the terminal glass was carefully removed manually to form a cavity-templated PDMS. b. Etching curve (g—t curve). The pipette was filled with 1 M NaCl (pH7.0) and etched in a bath containing 40% NH4F: 49% HF (30:1 v/v). When perforated, each pipette was transferred to a 1 M NaCl (pH7.0) solution every 5 to 10 s to determine the conductance at +20 mV. The unfilled symbols represent conductance of pores made from six independent nanocavities under standard fabrication processes (see text). Filled circles were mean conductance. Error bars represent standard deviation. Polynomial fitting of mean conductance yielded a continuous mean etching curve (black curve). c. The profile of the nanocavity (D—h curve) calculated from the etching curve (panel b), using Eq.1 in the text. The conductivity (K) of 1 M NaCl at 22 °C was 7.8 Sm-1. d. Magnified profile of the narrow end of the nanocavity. This section resembled a conical shape with an aperture of 20°, as marked by the dashed line.

