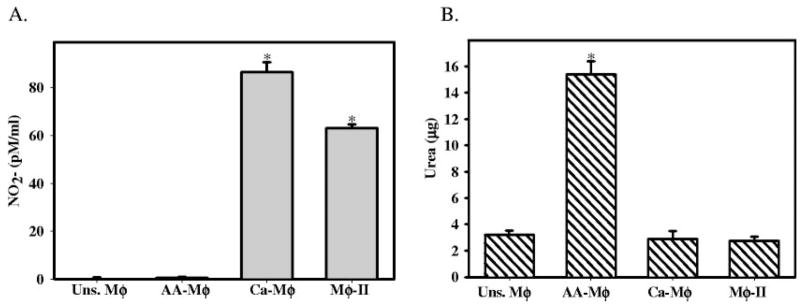
Fig. 2.
Activated Mφ exhibit different patterns of arginine metabolism. (A) NO2− accumulation after 24 h of Mφ activation measuring iNOS activity. Equal volumes of cell supernatants were mixed with Greiss reagent for 10 min, and the absorbance at 540λ was measured. A solution of NO2− was used to construct a standard curve. (B) Arginase assay measuring the formation of urea after incubation of lysates from activated Mφ with arginine. Arginase enzyme was activated by heating for 10′ at 55°C. The hydrolysis of arginine to ornithine and urea was conducted by incubating the lysates with L-arginine at 37°C for 60 min. The reaction was stopped, and urea was measured at 550 nm after addition of α-isonitrosopropiophenone followed by heating at 100°C for 30 min. Values were compared with a standard curve of urea concentration. Figures are representative of at least three independent experiments. Error bars indicate ± SD. *, P < 0.00001

