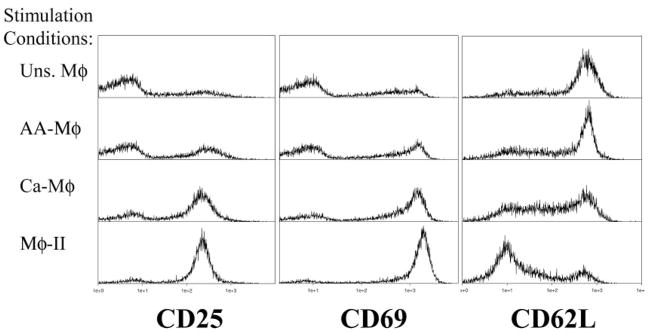
Fig. 6.
Activated Mφ drive different levels of T cell activation. DO11.10 T cells were stained after 24 h of coculture with unstimulated (top panels), AA-Mφ (upper-middle panels), Ca-Mφ (lower-middle panels), and Mφ-II (bottom panels) in the presence of antigen. T cells were selected by gating for Thyl.2+ cells and CD25 (left), CD69 (center), and CD62L (right). Figures are representative of at least three independent experiments.

