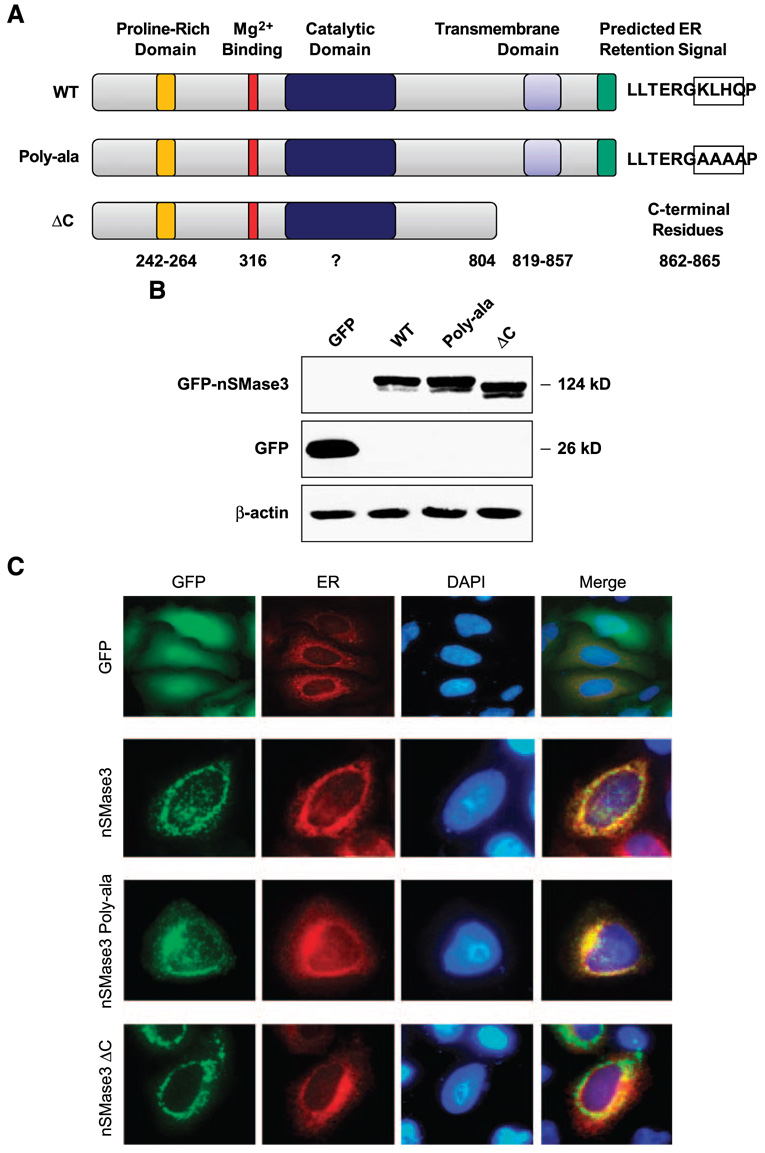
FIGURE 2. Subcellular distribution of GFP-tagged nSMase3.
A. Schematic illustration of full-length and mutation/deletion constructs of nSMase3. Numbers represent the amino acid residues corresponding to putative functional domains. Predicted KKXX-like signal (KLHQ) in WT nSMase3 and those residues changed to alanine in nSMase3 (Poly-ala) are boxed. B. Western blotting was done using an anti-GFP antibody to detect GFP and GFP-nSMase3 expression. The same blot was then probed for β-actin to show equal protein loading. C. HeLa cells were cotransfected with expression vectors carrying GFP or GFP-nSMase3 with pDsRed2-ER using Lipofectamine 2000. Cells were washed with PBS, fixed with 4% paraformaldehyde, and incubated with 4′,6-diamidino-2-phenylindole (DAPI) to stain nuclei. Cells were analyzed with an Olympus AX70 fluorescent microscope and photographs were captured using a digital camera. Photomicrographs of GFP-transfected cells are not to scale with those transfected with GFPnSMase3 expression vectors.

